
KSEEB Solutions for Class 9 Maths Chapter 15 Probability Points To Remember
EXPERIMENTAL APPROACH
- Probability is a quantitative measure of certainity.
- A trial is an action which will result in one or several outcomes.
- An event for an experiment is the collection of some outcomes of the experiment.
Probability of an event - The empirical(experimental) probability of an event E denoted by P(E) is given by
\(\mathrm{P}(\mathrm{E})=\frac{\text { Number of trials in which the event has happened }}{\text { Total number of trials }}\) - The sum of all the probabilities of all elementary events of an experiment is 1.
- Probability of an event lies between 0 and 1.
- Probability can never be negative.
- A pack of playing cards consists of 52 cards which are divided into 4 suits of 13 cards each. Each suit consists of 1 Ace, 1 King, 1 Queen, 1 Jack and 9 other cards numbered from 2 to 10. Four suits are spades, hearts, diamonds and clubs. King, queen and jack are face cards.
- The Probability of an impossible event is 0.
- If \(\mathrm{E}_1, \mathrm{E}_2, \mathrm{E}_3 \ldots . \mathrm{E}_{\mathrm{n}}\) are all possible outcomes of a trial, then\(\mathrm{P}\left(\mathrm{E}_1\right)+\mathrm{P}\left(\mathrm{E}_2\right)+\mathrm{P}\left(\mathrm{E}_3\right)+\ldots \ldots+\mathrm{P}\left(\mathrm{E}_{\mathrm{n}}\right)=1\)
| Class 9 Social Science | Class 9 Science | Class 9 Maths |
Probability Exercises 15.1
1. In a cricket match, a bats woman hits a boundary 6 times out of 30 balls she plays. Find the probability that she did not hit a boundary.
Solution: Let E be the event of hitting the boundary, then
\(\mathrm{P}(\mathrm{E})=\frac{\text { Number of times the batswoman hits the boundary }}{\text { Total number of balls she plays }}\) \(=\frac{6}{30}=\frac{1}{5}=0.2\)∴ Probability of not hitting the boundary
= 1 – Probability of hitting the boundary
= 1-P(E)
= 1 -0.2 = 0.8
2.1500 families with 2 children were selected randomly and the following data were recorded. Number of girls in a family 2 1 0
Number of families 475 814 211
Compute the probabilities of a family, chosen at random having
1. 2 girls 2. 1 girl 3. No girl, Also check whether the sum of these probabilities is 1.
Solution: Total number of families = 475 + 814 + 211 = 1500
1. Probability of a family, chosen at random having two girls = \(\frac{475}{1500}=\frac{19}{60}\)
2. Probability of a family, chosen at random having one girl = \(\frac{814}{1500}=\frac{407}{750}\)
3. Probability of a family, chosen at random having no girl = \(\frac{211}{1500}\)
Sum of these probabilities
\(\begin{aligned}& =\frac{19}{60}+\frac{407}{750}+\frac{211}{1500} \\
& =\frac{475+814+211}{1500}=\frac{1500}{1500}=1
\end{aligned}\)
Hence, the sum is checked.
KSEEB Class 9 Maths Chapter 15 Solutions PDF
3. In a particular section of class IX, 40 students were asked about the months of their birth. The following graph was prepared for the data so obtained. Find the probability that a student of the class was born in August.
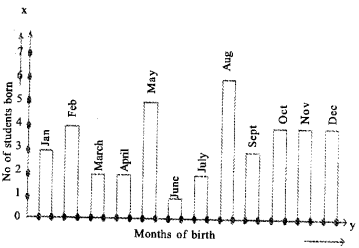
Solution: Total number of students born in the year = 3+4+2+2+5+1+1+6+3+4+4+4=40
The probability that a student of the class was born m August = \(\frac{6}{40}=\frac{3}{20}\)
4. Three coins are tossed simultaneously 200 times with the following frequency of different outcomes.
| Outcome | 3 heads | 2 heads | 1 head | No head |
| Frequency | 23 | 72 | 71 | 28 |
If the three coins are simultaneously tossed again, compute the probability of 2 heads coming up.
Solution: Total number of times the three coins are tossed = 200
Number of times when 2 heads appear = 72
∴ Probability of 2 heads coming up = \(\frac{72}{200}=\frac{9}{25}\)
5. An organization selected 2400 families at random and surveyed them to determine a relationship between income level and the number of vehicles in a family. The information gathered is listed in the table below
| Monthly income(in ₹) | Vehicles per family | |||
| 0 | 1 | 2 | Above 2 | |
| Less than 7000 | 10 | 160 | 25 | 0 |
| 7000-10000 | 0 | 305 | 27 | 2 |
| 10000-13000 | 1 | 535 | 29 | 1 |
| 13000-16000 | 2 | 469 | 59 | 25 |
| 16000 or more | 1 | 579 | 82 | 88 |
Suppose a family is chosen. Find the probability that the family chosen is
1. Earning ₹10000 -13000 per month and owning exactly two vehicles.
2. Earning ₹16000 or more per month and owning exactly one vehicle.
3. Earning less than ₹7000 per month and does not own any vehicle. ,
4. Earning ₹13000 -16000 per month and owning more than two vehicles.
5. Owning not more than one vehicle.
Solution: Total number of families selected = 2400
1. Number of families earning ₹10000 – 13000 per month and owning exactly two vehicles = 29
Probability that the family chosen is earning ₹ 10000 to 13000 per month and owning
exactly two vehicles = \(\frac{29}{2400}\)
2. Number of families earning ₹16000 or more per month and owning one vehicle = 579
∴ Probability that the family chosen is earning ₹16000 or more per month and owning exactly
\(\text { one vehicle }=\frac{579}{2400}=\frac{193}{800}\)3. Number of families earning less than 7000 per month and does not own any vehicle = 10
∴ Probability that the family chosen is earning less than₹7000 per month and does not own
\(\text { any vehicle }=\frac{10}{2400}=\frac{1}{240}\)4.Number of families earning ₹13000 to 16000 per month and owning more than 2 vehicles = 25
∴ Probability that the family chosen earning ₹3000 to 16000 per month and owning more than 2 vehicles = \(\frac{25}{2400}=\frac{1}{96}\)
5. Number of families owning not more than 1 vehicle = Number of family owning 0 vehicle + Number of families owning 1 vehicle = (10 + 0 + 1 + 2 + 1) +( 160 + 305 + 535 + 469 + 579)
= 14 + 2048 = 2062
∴ Probability that the family chosen owns not more than one vehicle = \(\frac{2062}{2400}=\frac{1031}{1200}\)
Karnataka 9th Standard Maths Chapter 15 Notes
6.
| Marks(out of 100) | Number of students |
| 0-20 | 7 |
| 20-30 | 10 |
| 30-40 | 10 |
| 40-50 | 20 |
| 50-60 | 20 |
| 60-70 | 15 |
| 70-above | 8 |
| Total | 90 |
1. Find the probability that a student obtained less than 20% in the mathematics test.
2. Find the probability that a student obtained marks 60 or above.
Solution: Total number of students = 90
1. Number of students obtaining less than 20% in the mathematics test = 7
∴ Probability that a student obtained less than 20% in the mathematics test = 7/90
2. Number of students obtaining marks 60 or above = 15 + 8 = 23
∴ Probability that a student obtained marks 60 or above = 23/90
7. To know the opinion of the students about the subject statistics, a survey of 200 students was conducted. The data is recorded in the following table.
| Opinion | Number of students |
| Like | 135 |
| Dislike | 65 |
Find the probability that a student chosen at random
1. Like statistics
2. Does not like it
Solution: Total number of students = 200
1. Number of students who like statistics =135
∴ Probability that a student chosen at random like statistics = \(\frac{135}{200}=\frac{27}{40}\)
2. Number of students who like statistics =65
∴ Probability that a student chosen at random does not like it = \(\frac{65}{200}=\frac{13}{40}\)
KSEEB Class 9 Maths Probability Solutions
8. The distance (in km) a 40 female engineers from their residence to their place of work were found as follows:
5 3 10 20 25 11 13 7 12 31 19 1012 17 18 11 32 17 16 2 7 9 7 8 3 5 12 15 18 3 12 14 2 9 6 15 15 7 6 12
What is the empirical probability that an engineer lives?
1. Less than 7 km from her place of work?
2. More than or equal to 7 km from her place of work?
3. Within 1/2 km from her place of work?
Solution: Total number of female engineers = 40
1. Number of female engineers whose distance(in km) from their residence to their place of work is less than 7 km = 9
∴ Probability that an engineer lives less than 7 km from her place of work = 9/40
2. Probability that an engineer lives more than or equal to 7 km from her place of residence = 1 – Probability that an engineer less than 7 km from her place of work.
\(=1-\frac{9}{40}=\frac{31}{40}\)3. Number of female engineers whose distance(in km) from their residence to their place of work is within 1 /2 km = 0
∴ Probability that an engineer lives within 1/2 km from her place of work = \(\frac{0}{40}=0\)
11. 11 bags of wheat flour, each marked 5kg actually contained the following weights of flour(in kg).
4.97 5.05 5.08 5.03 5.00 5.06 5.08 4.98 5.04 5.07 5.00
Find the probability that any of these bags chosen at random contains more than 5 kg of flour.
Solution: Total number of bags of wheat flour = 11
Number of bags of wheat flour containing more than 5 kg of flour = 7
∴ Probability that any of the bags chosen at random, contains more than 5kg of flour= 7/11
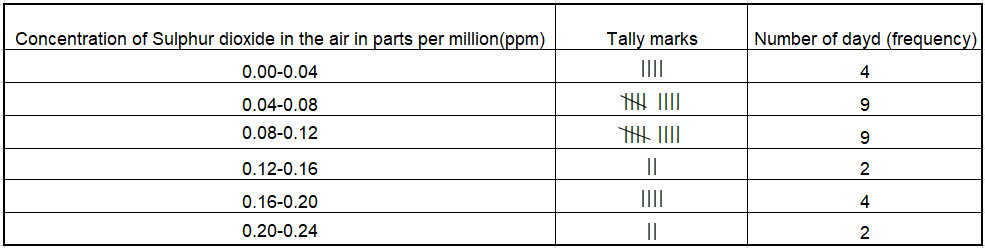
12. A study was conducted to find out the concentration of Sulphur dioxide in the air in parts per miilion(ppm) of a certain city. The data obtained for 30 days is as follows:
0. 03 0.08 0.08 0.09 0.04 0.17 0.16 0.05 0.02 0.06 0. 18 0.20 0.11 0.08 0.12 0.13 0.22 0.07 0.08 0.01 0.10 0.06 0.09 0.18 0.110.07 0.05 0.07 0.01 0.04
You were asked to prepare a frequency distribution table, regarding the concentration of Sulphur dioxide in the air in parts per million of a certain city for 30 days. Using this table, find the probability of the concentration of Sulphur dioxide in the interval 0.12-0.16 on any of these days.
Solution: Total number of days = 30
Number of days on which the concentration of Sulphur dioxide is in the interval 0.12-0.16 = 2 ∴ Probability that the concentration of Sulphur dioxide is in the interval 0.12-0.16 on any of these days = \(\frac{2}{30}=\frac{1}{15}\)
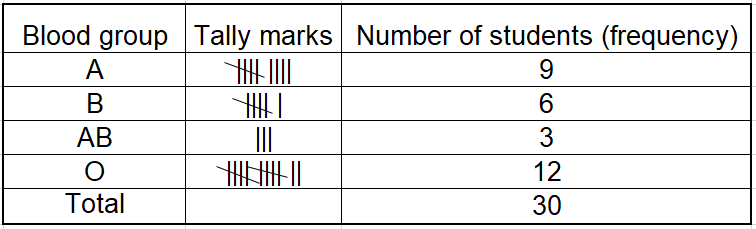
13. The blood groups of 30 students of class VIII are recorded as follows:
A, B, O, O, AB, O, A, O, B, A, O, B, A, O, O, A, AB, O, A, A, O, O, AB, B, A, O, B, A, B, O.
Represent this data in the form of a frequency distribution table. Find out which is the most common and which is the rarest blood group among these students.
You were asked to prepare a frequency distribution table regarding the blood groups of 30 students of a class. Use this table to determine the probability that a student of this class, selected at random has blood group AB.
Solution: Total number of students = 30
Number of students having blood groups AB = 3
∴ Probability that a student of this class selected at random, has blood group
AB = \(\frac{3}{30}=\frac{1}{10}=0.1\)
Frequency Distribution table
Multiple Choice Questions
1. The minimum probability of an event is
- 0
- 1
- 1/2
- -1
Solution: 1. 0
2. What is the number of outcomes when a coin is tossed?
- 1
- 2
- 4
- 6
Solution: 2. 2
3. What is the number of outcomes when a cubical dice is thrown?
- 2
- 4
- 6
- 3
Solution: 3. 6
KSEEB Class 9 Maths Probability Solutions
4. When a coin is tossed 500 times, the following outcomes were recorded
Head: 270 Times
Tail: 230 Times
If now a coin is tossed the probability of getting a head is
- 27/50
- 23/50
- 1
- 2/25
Solution: 1. 27/50
5. An experiment has two outcomes E and F, P(E) + P(F) is equal to
- 1
- 0
- 2
- 1/2
Solution: 1. 1
KSEEB Class 9 Maths Chapter 15 Exercise Solutions
6. In the throw of a dice in a game of ludo, the probability of getting an even number is
- 1
- 0
- 1/2
- 2
Solution: 3. 1/2
7. An experiment has two outcomes E and F, P(E) + P(F) is equal to
- 1
- 0
- 2
- 1/2
Solution: 1. 1
8. One person is to be selected out of a group of 7 men and 3 women. The probability of selection of a man is
- 3/7
- 7/10
- 3/10
- 1
Solution: 2. 7/10
9. Which of the following cannot be the experimental probability of an event?
- 15/100
- 3/2
- 0.17
- 6/17
Solution: 2. 3/2
10. Reena dialled a phone number 100 times in a week out of which she gets the response 55 times. The probability that she will not get the response is
- 55/100
- 100/55
- 45/100
- 100/45
Solution: 3. 45/100
Probability Additional Questions
1. The probability of guessing the correct answer to a certain question is x/3. If the probability of not guessing the correct answer is 5x/3, then find the value of x.
Solution: P(E) + P(E’) = 1
\(\begin{aligned}& \frac{x}{3}+\frac{5 x}{3}=1 \\
& \frac{x+5 x}{3}=1 \\
& 6 x=3 \\
& x=\frac{3}{6}=\frac{1}{2}
\end{aligned}\)
2. A survey of 200 people was conducted about their preference of visiting various pavilions.
| Pavilion | Good living | Delhi pavilion | Toy pavilion | Defence |
| Number of people | 95 | 45 | 40 | 20 |
Find the probability that selected person visited:
1. Both Good living and Delhi pavilion
2. Only Defence pavilion
3. Only Toy pavilion
4. Both toy and Defence pavilion
Solution: Total number of people = 200 .
(1) P(Good living and Delhi pavilion) = \(\frac{95+45}{200}=\frac{140}{200}=\frac{7}{10}\)
(2) P(only Defence pavilion) = \(\frac{20}{200}=\frac{1}{10}\)
(3) P only (Toy pavilion) = \(\frac{40}{200}=\frac{1}{5}\)
(4) P(both Toy and Defence pavilion) = \(\frac{40+20}{200}=\frac{60}{200}=\frac{3}{10}\)
3. On a busy road, following data was observed about cars passing through it and the number of occupants. Find the chance that it has:
1. Exactly 5 occupants
2. More than 2 occupants
3. Less than 5 occupants
| Number of occupants | 1 | 2 | 3 | 4 | 5 |
| Number of cars | 29 | 26 | 23 | 17 | 5 |
Solution: Total number of cars = 100
1. P(Exactly 5 occupants) = \(\frac{5}{100}=\frac{1}{20}\)
2. P(More than 2 occupants) = \(\frac{23+17+5}{100}\) = \(\frac{45}{100}=\frac{9}{20}\)
3. P(Less than 5 occupants) = \(\frac{29+26+23+17}{90}[latex] = [latex]\frac{95}{100}=\frac{19}{25}[latex]
Class 9 Maths Probability KSEEB Guide
4. 50 plants were shown in 5 different colonies. A, B, C, D & E. After 30 days, the number of plants survived as follows What is the probability that:
1. More than 40 plants survived in a Colony?
2. Less than 41 plants survived in a Colony?
3. Which values are depicted from the above data?
| Colony | A | B | C | D | E |
| No. of plants survived | 40 | 45 | 42 | 38 | 41 |
Solution: We have total number of colonies = 5
1. Number of colonies in which more than 40 plants survived = 3(B, C and E)
∴ P(more than 40 plants survived in a Colony) =3/5
2. Number of colonies in which less than 41 plants survived = 2(A and D)
∴ P(less than 41 plants survived in a Colony) = 2/5
3. In order to keep the environment safe, we should grow more and more plants.
5. There are 13 girls and 15 boys in a line. If 1 student is chosen at random find the probability that he is a boy.
Solution: Number of boys = 15
Number of girls =13
Total number of students =15 + 13=28
∴ Probability of selecting a boy = 15/28
KSEEB 9th Standard Maths Chapter 15 Important Questions
6. A dice is thrown, what will be the probability of getting an even number?
Solution: Favourable number of outcomes = 3(2,4,6)
Total number of outcomes = 6
Required probability = [latex]\frac{3}{6}=\frac{1}{2}\)
7. In a one-day cricket match, Sachin played 40 balls and hit 12 sixes and Saurav played 30 balls and hit 9 fours. Find the probability that Sachin will hit a six in the next ball and also find the probability that Saurav will not hit a 4 in the next ball.
Solution: Total number of balls faced by Sachin = 40 Number of balls on which he hit a six = 12 Let Ej be the event of hitting a six Number of favourable outcomes = 12
∴ \(P\left(E_1\right)=\frac{12}{40}=\frac{3}{10}\)
Now, total number of balls faced by Saurav = 30
Let E2 be the event that Sourav did not hit a . boundary.
Number of favourable outcomes = 30-9 = 21
∴ \(P\left(E_2\right)=\frac{21}{30}=\frac{7}{10}\)
8. A coin is tossed for a certain number of times. If the probability of getting a head is 0.4 and the head appeared up for 24 times, find the number of times the coin was tossed. Hence, find the probability of getting a tail and verify that P(H) + P(T) = 1
Solution: Let x be the number of times a coin is tossed As probability (Head) = 0.4
and Number of favourable outcomes = 24
=> P(4) = 0.4 = 24/x
=> x = 24/0.4 = 60
∴ 60 times the coin was tossed
Hence, number of times tail turned up = 60 – 24 =36
∴ Probability of getting tail = \(\frac{36}{60}=\frac{6}{10}=0.6\)
P(H) + P(T) = 0.4 + 0.6 = 1
Karnataka Board Class 9 Maths Chapter 15 MCQs
9. The king, queen and jack of clubs are removed from a deck of 52 cards and then well shuffled. One card is selected at random from the remaining cards. Find the probability of getting 1. A heart 2. A king 3. The 10 of hearts
Solution: Total number of cards in the deck when king, queen and jack of clubs are removed
= 52 – 3 = 49
1. Number of cards which are ‘a heart’ = 13
∴ Probability of getting a heart = 13/49
2. Number of cards which are ‘a king’ = 3
∴ Probability of getting a king = 3/49
3. Number of cards which are ‘the 10 of heart’ = 1
∴ Probability of getting the ‘ 10 of a heart’ = 1/49