
KSEEB Solutions for Class 8 Geography Chapter 6 Human Resources Textbook Questions
Question 1. Answer the following questions:
(a)Why are people considered a resource?
Answer. People are a nations greatest resource as natural resources can be made useful and significant only when man applies his/her technical know-how. Human resource is the ultimate resource and it is called so by developing human skills. Resources are not, but they become by man.
(b)What are the causes for the uneven distribution of population in the world?
Answer. The causes for the uneven distribution in the world are:
- Topography,
- Climate,
- Fertile soil,
- Mineral deposits,
- Water.
(c) The world population has grown very rapidly. Why?
Sslc Class 8 Geography Human Resources Question And Answers
Answer. The world population is increasing very rapidly due to increase in the natural growth rate. Natural fed growth rate is the difference between the birth rate and the death rate of a country. With the development in medical and health care services, the death rate has declined drastically, although the birth rate is still high.
(d)Discuss the role of any two factors influencing population change.
Answer. The population change refers to change in the number of people during a specific time. The world population has not been stable. Two factors which influence population change are
- Birth and death rate and Migration
Birth and death rate: Population change is the result of birth and death. The natural growth rate is the difference between the death rate and the birth rate of a country.
Migration: The other way in which population size changes is migration. It is a process in which people move out of a particular country or move to a different part of the same country. The people leaving the country are called Emigrants and the people who arrive in the country are called Immigrants.
(e)What is meant by population composition?
Answer. Population composition refers to the structure of the population. It helps to bring to light elements such as male-female ratio, age-group, literacy level, occupation, income levels and health conditions. In brief, population composition tells about almost each and every thing regarding population of a country.
(f) What are population pyramids? How do they help in understanding about the population of a country?
Answer. Population pyramids, also called age-sex pyramids, are demographic structures based on the division of population of a country’ into different age groups.
- Population pyramids help in understanding the various age groups, e.g., 5 to 9 years, 10 to 14 years etc.
- They also help us in understanding the percentage of the total population, subdivided into males and females, in each of these groups.
- It tells us how many dependents (young and elderly) are there in a country.
- It also tells about birth and death rates.

Kseeb Class 8 Geography Chapter 6 Human Resources Solutions Pdf
Question 2. Tick the correct Answer:
(a)What does the term population distribution refer to?
- How population in a specified area changes over time.
- The number of people who die in relation to the number of people born in a specified area.
- The way in which people are spread across a given area.
Answer. (3)
(b)Which are three main factors that cause population change?
- Births, deaths and marriage
- Births, deaths and migration
- Births, deaths and life expectancy.
Answer. (2)
(c)In 1999, the world population reached
(a) I billion (b) 3 billion (c) 6 billion.
Answer. (c)
Class 8 Geography Chapter 6 Human Resources Summary Kseeb
(d)What is a population pyramid?
(a)A graphical presentation of the age, sex composition of a population.
(b)When the population density of an area is so high that people live in tall buildings.
(c)Pattern of population distribution in large urban areas.
Answer. (a)
Question 3. Complete the sentences below using some of the following words: sparsely, favourable, fallow, artificial, fertile, natural, extreme, densely, populated When people are attracted to an area it becomes populated. Factors that influence this include climate; good supplies of resources and land.
Answer. When people are attracted to an area it becomes densely populated. Factors that influence this include favourable climate; good supplies of natural resources and fertile land.
KSEEB Class 8 Geography Solutions For Human Resources
Human Resources Very Short Answer Type Questions
Question 1. What is the aim of Ministry of Human Resource Development?
Answer. The aim of Ministry of Human Resource Development is to improve people’s skills.
Question .2. Name the crowded areas of the world.
Answer. South Asia, South East Asia, Europe and North Eastern America.
Question .3. Which areas are sparsely populated?
Answer. High mountains, high latitude areas, tropical deserts and areas at equatorial forests are sparsely or less populated.
Question.4. In how many countries sixty per cent of the world’s people are staying?
Answer. In 10 countries, sixty per cent of the world’s people are staying.
Kseeb Class 8 Geography Human Resources Textbook Solutions
Question .5. Which geographical factors affect the distribution of population?
Answer. Geographical factors affecting the distribution of population are:
- tomography
- climate
- Water
- soil
- minerals.
Question 6. What kind of people are the future of an nation?
Answer. Skilled, spirited and hopeful young people endowed with a positive outlook are the future of any nation.
Questions 7 Which parts of our country are moderately populated?
Answer The plateau of Deccan and Central India, large parts of Punjab, Haryana and Gujarat.
Question 8. Which parts of India are most thickly populated?
Answer. Ganga and Brahmaputra Delta, the plains, the deltas of Mahanadi, Godavari, Krishna and Kaveri and the Malabar coastal strip.
Questions 9. Give three causes for high birth rate in India.
Answer
- Early marriage.
- Lack of education
- Agricultural economy.
Questions 10. What is the main cause of high growth rate of the Indian population?
Answer. The widening gap between death rate and birth rate is the main cause of high rate of population growth.
Human Resources Class 8 Geography Kseeb Important Questions
Questions 11.What elements are included in the composition of population?
Answer Age, sex, literacy, occupation, language, religion, ethnicity, etc.
Questions 12 What is meant by sex composition?
Answer. It means the proportion of males and females in total population.
Questions 13 What is favourable and unfavourable sex ratio?
Answer. If sex ratio is more than 1000, it is favourable. If sex ratio is less than 1000, it is unfavourable.
Questions 14 What is the role of women in developing the country?
Answer. Women do household works, they help in the process of development and educate their children. Women train their children to become the future human resources.
Kseeb Class 8 Geography Human Resources Solved Exercises
Human Resources Short Answer Type Questions
Question 1 . Why is population considered a human resource?
Answer. Every human being is a potential resource for the country. People can use their skill to produce more. By providing education, training, nutritious food and health facilities people become a real resource.
Question 2. How is density of population measured?
Answer. The density of population is measured by taking the number of people living in per square kilometre of the surface area. India’s average population density is 382 persons per sq. km.
Question 3. ‘Plains occupy about half the world’s land surface but support more than 90% of world population’. Give reason.
Answer.
- People always prefer plains for settling.
- They can easily develop activities like farming, manufacturing and service activities.
Class 8 Geography Human Resources Notes Karnataka Board
Question 4. What is meant by dependent population?
Answer. Persons which do not contribute directly to any economic or productive activity are called dependent population. Generally, persons above 60 years and children below 15 years (0-14 age group) belong to this group. About 60% of India’s total population is dependent population.
Question 5. How does topography affect the distribution of population?
Answer. People always prefer to settle on plains because it is very easy to do farming, constructing and other developmental activities. These area are suitable for construction of roads, building factories. It is easy to live on plains rather than mountains. The Ganga-Brahmaputra plains are most densely populated areas of the world while mountains like Andes, Himalayas and Alps are thinly populated.
Question 6. How does soil affect the distribution of population?
Answer. Soil affects the distribution of population. The areas which have fertile soil has thick population because fertile soils provide suitable land for agriculture. So people like to live in such areas. The fertile plains of Ganga and Brahmaputra in India, Hwang-Ho, Chang Jiang in China and Niles in Egypt are densely populated.
Question .7. Water plays an important role in the distribution of population. Explain.
Answer. It is true that water plays an important role in the distribution of population. Early civilisations flourished in river valleys. People prefer to live in the areas where fresh water is easily available. The river valleys are densely populated while deserts have sparse population.
Question .8. The Government has to make efforts in providing health and education facilities to younger section of the population. Elucidate.
Answer. It has 34% of its population which lies in the younger age group, who have a great share in the working age group.
Explanation of Human Resources KSEEB Class 8 Geography
Question 9. The sex ratio has been generally declining ever since 1901. Why?
Answer. In the Indian society, the female child is neglected. Male population dominates our society. There is high death rate among females. Death rate is particularly high among marred women. Due to such social evils present in the Indian society, sex ratio is declining. The sex ratio which was 972 in 1901 has been declined to 940 in 201 1.
Question 10.What factors control the distribution of population on the Earth?
Answer. The population is distributed unevenly. This is due to rugged topography and steep slopes. Low lying areas, desert areas, forests, plains and river valleys are densely populated. 90% of world population occupies only 30% area of land.
Human Resources Class 8 Geography Summary And Explanation Kseeb
Question. 11 Distinguish between:
- Birth rate and Growth rate.
- Total population and Density of population.
Answer.
- Birth rate and Growth rate: Birth rate Growth rate
(a) It is the number of people bom in a regior during a certain period of time. (a) It is the rate at which the population grows in a region during a certain period of time.
(b) It is calculated for every 1000 persons for a year. (b) The growth rate of population is expressed in percentage during a certain period of time.
(c) High birth rate shows an increasing population. (c) When birth rate is more than death rate, it indicates a positive growth rate. - Total Population and Density of Population
Total Population Density of Population
(a) It is the number of people actually existing in the area. (a) It is the number of people per unit area.
(b) It is counted during a census conducted after every 10 years. (b) The density of population in India was 382 per sq. km. in 2011.
(c) Total population of India was 121.02 crores in 201 1. (c) It is expressed as average number of persons per sq. km. or mile.
Human Resources Long Answer Type Questions
Question 1 . What are the reasons for the rapid growth of population?
Answer.
- In 1921, India’s population was 251 million while in 2011, it is over 1210 million. This ‘rapid growth of population is largely due to a fall in the number of deaths and an increase in the birth rate. New techniques of controlling or eradicating certain diseases also lower the death rates.
- Another reason of population growth is migration. Population also increases when in-migration is more than out-migration. The growth rate of our population was 11 per cent between 1921 and 1931. But it became more than double to 24.7 per cent between 1971 and 1980. Today, we are the second most populated country in the world after China.
Question 2. What is the effect of rapid growth of population on the economic development of a country?
Answer.
Population growth has a great influence on the economic and social status of a country. It influences the gainful utilisation of the resources. In general, it has been observed that in the developed countries, the growth rate of population is low’. Thus, the standard of living is high. It is the reverse in under¬developed countries where most of the people are engaged in primary occupations, like agriculture and mining. They have a low standard of living.
Sslc Class 8 Geography Chapter 6 Workbook Answers
Question.3. Name the moderately populated areas and give reasons for this.
Answer.
The areas whose population is mostly found between the densely populated regions and the sparsely populated regions are known as moderately populated areas. In these areas, facilities of irrigation and mining have improved. In some regions, new-‘ industries have developed. In these areas, favourable natural and economic factors attracted people from other regions. Deccan plateau of India, Eastern Europe, Central China, Tropical West Africa, Southern parts of Russia are some examples of moderate areas.
Question .4. What is population change?
Answer. When we compare the total population of a country in one year with another year, then we come to know about the population change-whether it has increased, decreased or is stable. This phenomenon is known as population change. For example, world’s population was just 100 million in 500 B.C.E and it became 900 million in 1800 C.E. In the next 150 years, it shot up to more than double i.e., 2500 million in 1950 CE. In the next 50 years, it again doubled as in 1999 rt was 6000 million (6 billion).
Free KSEEB Notes For Class 8 Geography Human Resources
Question .5. What is a population pyramid? Explain the main features of the population pyramids of India, Japan and Kenya.
Answer.
Population pyramids are graphically drawn to show the age-sex composition of the population. Age group is shown on the vertical scale at 5-year intervals and the male-female population in millions is shown on the horizontal scale. The younger age group is shown at the base, while the older population is shown at the top. It is called a population pyramid because it rises in steps to a pointed top.
- The main features of the population pyramids of India, Japan and Kenya are
- Kenya: Being characterised by a high Birth Rate as well as a high Death Rate, Kenya is a developing country. A large number of children are bom, but most of them die in infancy due to the lack of medical services and comparatively a very a few survive till adulthood. Likewise, there are comparatively few old people. This is a characteristics of the pyramid being cone¬shaped with a broad base and a narrowing top, as there are very few old people.
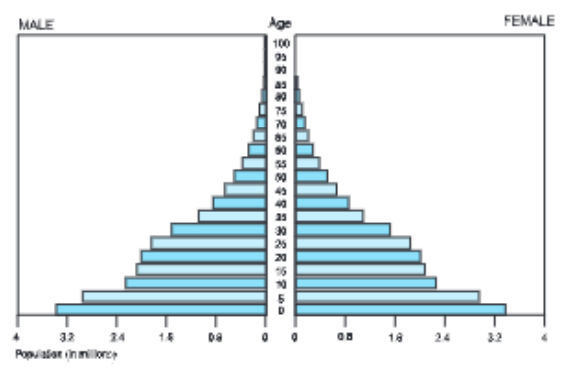
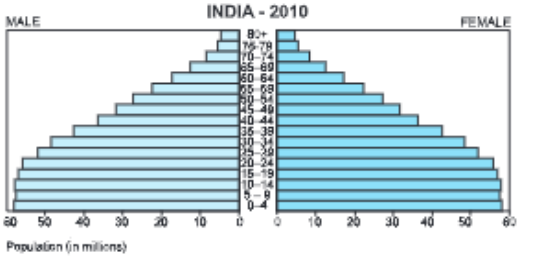
- India: India is also a developing nation, but the economic status is better than that of Kenya. This is why, although the Birth Rate is high, the Death Rate is low on account of expanding health services and better nutrition. India’s Death Rate is declining which allows infants to survive till adulthood. This causes the population pyramid to be broad at the base and bulge in the middle. A large number of adult population means a strong and healthy work force.
Class 8 Geography Kseeb Human Resources Short And Long Answer Questions
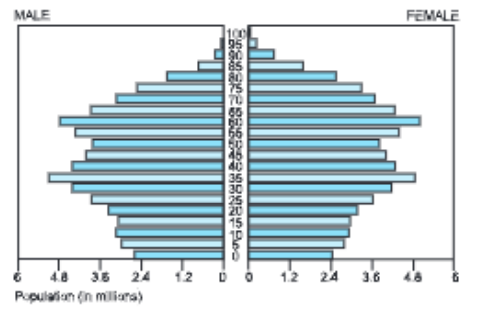
- Japan: Japan is a developed economy and hence has a Low Birth Rate and a Low Death Rate. Due to this fact, population pyramid is narrow at the base, expands in the middle and again becomes narrow on the top. A decrease in the Death Rate allows people to survive and reach old age.
Question .6. Describe the factors controlling the distribution of population.
Answer.
Distribution and Density: One of the important aspects of world’s population is its uneven distribution. The population depends upon the following factors Geographical Factors
- Topography: It is one of the most important factors affecting the distribution of population. People always prefer plains rather than mountains and plateaus to settle because activities such as farming, manufacturing and service activities can easily be developed on plain regions. Plains occupy about half the world’s land surface but support more than 90% of the world’s population.
- Climate: Regions having very hot or very cold climates are usually avoided by the people. That is why the equatorial parts of Africa and the polar regions of Russia, Canada and Antarctica have practically no population. Deserts also do not support people. Regions having temperate climate with moderate rainfall are densely populated. For example, countries of Eastern Asia and Western Europe.
- Soil: Soil is the most important factor affecting agriculture. It helps us in obtaining food, clothing and shelter. Thus fertile plains such as those of the Ganga and Brahmaputra in India, the Hwang Ho and the Changjiang in China, and the Nile in Egypt are some of the densely populated areas.
- Existence of Mineral Deposits: The discoveries of minerals in different parts of the world have attracted people. The diamond mines of South Africa and the discover)- of oil fields in the Middle-East are some examples.
- Social and Economic Factors: Religious, cultural, industrial and commercial centres attract people from all over the world. Some of the cities in India such as Varanasi in Uttar Pradesh, Puri in Odisha, Kancheepuram in Tamil Nadu, Tirupati in Andhra Pardesh Vatican city and Jeruselum city are examples of religious centres. Cities such as Mumbai, Bengaluru, Kolkata, New York are some examples of industrial and commercial centres.
KSEEB Class 8 Geography Chapter 6 Important Questions
Question.7. Give a reason of the unfavourable sex ratio in India.
Answer. Reasons for unfavourable sex ratio are:
- Females are neglected.
- Girls are killed just after birth, i.e., female infanticide.
- Girl child is killed before birth and is called female foeticide.
- Females d e as girl child due to negligence or deliberated attempts.
- Women die at the time of child birth.
Question 8 Define the following:
Answer.
- Birth Rate
- Death Rate
- Infant Mortality Rate
- Life Expectancy
- Natural Increase
- Demographic Structure
- Sex Ratio
- Census.
- Birth Rate is the number of live births in a year per 1000 of the population of an area. At present the birth rate in India is 20.97.
- Death Rate is the number of deaths in a year per 1000 of the population of an area. At present, the death rate of India is 7.5.
- Infant Mortality Rate is the number of deaths of children below one year of age per 1000 of population of an area.
- Life Expectancy is the average at which people of a country die. It is at the age upto which most of the people of a country are expected to live. In India, the life expectancy is 67.5 years while in Britain it is 72 years.
- Natural Increase is the difference of birth rate and death rate of country per 1000 of population. It shows excess of births over deaths. In India, the average natural increase has been 1.9 per year.
- Demographic Structure is the division of population of a country into different groups and is shown by a pyramid. Age, sex structure is also shown in this way.
- Sex Ratio is defined as the number of females per thousand males. In India, the sex ratio is 940.
- The Census is the counting of population of a country. It takes place every ten years.
Human Resources Hots Corner
Question 1. Which social factors affect the distribution of population?
Answer.
- Areas of better housing
- education
- health facilities.
Question 2. What do you mean by the pattern of population distribution?
Answer. The way in which people are spread across the earth surface is known as the pattern of population distribution.
Question 3. Which state in India has the largest population?
Answer. According to 2011 census, Uttar Pradesh has :he largest population in India It has a total population of 19,95,81,477 persons. It is about 16.49% of India’s total population.
Question 4. Which state in India has the highest density of population?
Answer. The highest density’ of population in India is found in Bihar. It has density of 1, 102 persons per sq. km (2011).
Question 5. The equatorial parts of Africa and the polar regions of Russia, Canada have practically no population.
Answer. These regions have extreme climate. The equatorial parts of Africa are very hot and the polar regions are very cold. So practically, the population is very scarce in these regions.
Class 8 Kseeb Geography Human Resources Map-Based Questions
Question.6. Which areas of India have low density of population and why?
Answer. India’s hilly states of North and North-East have very low density of population. It is 86 in Sikkim, 119 in Nagaland, 124 in Jammu and Kashmir 132 in Meghalaya, 122 in Manipur, 17 in Arunachal, 52 in Mizoram and 123 in Himachal Pradesh. In these areas hilly terrain, low temperature, lack of meAnswer of trAnswerport and unfavourable climate have a great influence.
Question.7. What is age composition? Or Why is age composition important in the study of population?
Answer. Age composition is very important in the study of population. If the children below 14 years are more, then the increase in population will be more in future. Migration of people also affects the age composition. If there are more people in the age group 0-14 years and above 65 years, then more people are dependent on the available resources.
Question.8. ‘Manpower is not assessed in terms of numbers alone’. Why?
Answer. Manpower is a vital resource of a country. It is the power w hich exploits the natural resources of a country. It must be educated, efficient, skilled and gifted with scientific knowledge. Healthy, educated, capable, hardworking and energetic people make the real manpower.
Question.9. ‘More people live in north of equator than in south of equator’. Justify.
Answer. Densely populated area of China. India, Asia, Cu’ope and North America are found in north of Equtator. But sparsely populated areas of South America, Africa, Australia are found in south of equator.
Question 10. Write a note on sex composition, age structure and literacy rate in the world with special reference to India.
Answer. Composition of Human Resources: The composition of human resources of a country includes age, sex, literacy, occupation, ethnicity, tribe, language and religion.
- Sex Composition: This means the proportion of males and females in the total population. It is expressed with the help of sex ratio. Sex ratio is defined as the number of females per 1000 males in the population.
- In India, the sex ratio is 940. For every 1000 males, there are only 940 females. Kerala and Pondicherry have sex ratio of 1084 and 1038 respectively.
- Age Structure: The agewise distribution of people helps the government to plan for the people on various aspects. The population is divided into three age groups: (a) 0-4 year, (b) 15 64 years and (c) more than 65 years. India has 34% of ratio population in the younger age group.
- Literacy Rate: Literacy means the ability- to read, write and understand a simple message in the form of a language. If a person who is able to read but cannot write is considered as illiterate.
- In India, a person is literate when he or she is aged 7 and above and is able to read, write and understand a simple statement in the farm of a language. At the time of Independence, only about one sixth of the population was literate. In 2011, 65% of the population was literate in India. In India more males are literates than females.
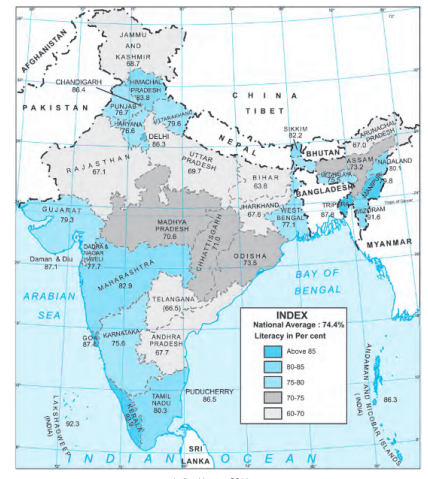
(a)High Literacy States: Kerala, Mizoram, Lakshadweep, Goa, Delhi, Chandigarh, Puducherry , Daman & Diu, Andaman & Nicobar Islands, Maharashtra, Himachal Pradesh and Tripura have high literacy.
(b)Low Literacy States: Bihar, Jharknand, Jammu & Kashmir, Arunachal Pradesh, Uttar Pradesh, Dadra & Nagar Haveli, Rajashtan, Andhra Pradesh, Meghalaya. Odisha, Madhya Pradesh, Assam are low literacy states.
Simplified Notes For Human Resources KSEEB Class 8
Human Resources Map Based Questions
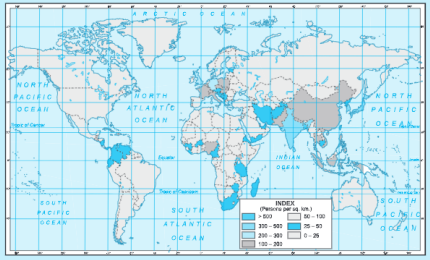
Question 1. Study the map given and Answer the following questions:
- Which continent has very high annual rate of natural increase in population growth?Answer. Africa.
- Name two continents which have low annual rate of natural increase in population growth.Answer. Europe, Australia.
Question.2. Study the chart given below and Answer the following questions:
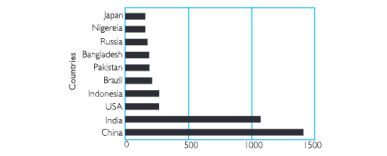
- Which is the world’s most popular country?
Answer China - Which is the 2nd most populous country?
Answer. India. - In the above chart, find out how many countries are in Asia.
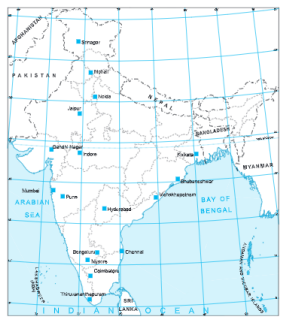
Answer. In the above chart, 6 countries-China, India, Indonesia, Pakistan, Bangladesh and Japan are in Asia. - Show the Software Technology Parks on the map of India.
Answer.
Human Resources Miscellaneous Questions
A. Multiple Choice Questions Tick the correct option from the choices provided:
Question.1. What was the total population of world in 2011?
(a) 5 billion
(b) 6 billion
(c) 7 billion
(d) 8 billion
Answer. (c) 7 billion
Question.2. What was the total population of India in 2011?
(a) 100 crore
(b) 101 crore
(c) 121 crore
(d) 103 crore
Answer. (c) 121 crore
Question 3. What is the average density of population in world?
(a) 30 persons per sq. km.
(b) 35 persons per sq. km.
(c) 40 persons per sq. km.
(d) 45 persons per sq. km.
Answer.
(d) 45 persons per sq. km.
Karnataka Board Class 8 Geography Human Resources Important Notes
Question.4.What is the average density of population of India (per sq. km) in 2011;
(a) 310
(b) 315
(c) 370
(D)382
Answer. (d) 382
Question.5. When was the Ministry of Human Resource Development established?
(a) In 1981
(b) In 1983
(c) In 1985
(d)In 1987
Answer.(c) in 1985
Question.6. Which of these is not a sparsely populated area?
(a) Deserts
(b) Forests
(c) Mountains
(D)Plains
Answer.(d) Plains
Question.7.How many countries have their population more than ten crores?
(a) Five
(b) Six
(c) Seven
(D)Ten
Answer. (d) Ten
Question.8. Which continent has only one per cent population of world?
(a) North America
(b) europe
(c) Asia
(d) Australia
Answer. (d) Australia
Question.9. Which is densely populated area?
(a) Ganga plain
(b) Andes
(c) Alps
(D) Himalayan
Answer. (a) Ganga plain
Question 10. What is the cause of high growth rate of population?
(a) High birth rate
(b) Low birth rate
(c) High death rate
(D)Low death rate
Answer. (d) Low death rate
B.One Word Sentence Answer
Answer the following questions in one word/sentence:
- What is the average density of population in India?
Answer. 382 persons per square Km. - How much population of the world is found on 10% land of world?
Answer. 90%.
- Which Indian state has the highest density of population?
Answer. Bihar-1 102 persons. - Which Indian state has the lowest population density?
Answer. Arunachal Pradesh-17 persons. - Which Indian state has the largest population?
Answer. Uttar Pradesh-more than 20 crores. - What is the average density of population in the world?
Answer. 45 persons per sq. km. - What is the total population of the world?
Answer. More than 7 billion. - What was the total population of India in 2010?
Answer. 121 crores. - Which year is known as “great divide” in the history of population of India?
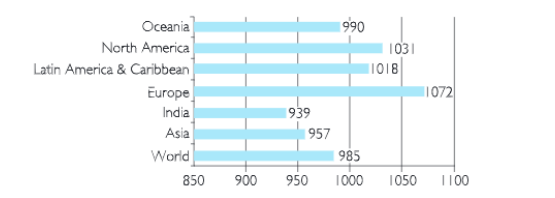
Answer. Year 1921. - What is the sex ratio of the world?
Answer. 985 females per 1000 males.
Human Resources C.Fill in the Blanks
- ________________ is a country which has high population growth rate.
Answer. Kenya - ___________________ministry looks after the education of us all.Answer. Human Resources Development
- ___________and are the three characteristics of population which make human resource.Answer. Health, Education, Skill.
- India ranks___________________in the world population.Answer. second after China
- _____________is the number of years that an average person can expect to live.Answer. Life expectancy
- The difference between the death rate and the birth rate of a country is called the .Answer. natural growth rate
- The number of live births per 1000 people is known asAnswer. birth rate
- The number of deaths per 1000 people is known asAnswer. death ‘rate
- _________is the movement of people in and out of an area.
Answer. Migration - The difference between the birth rate and the death rate of a country is called
the .Answer. natural growth rate - _____________is a country which have low population growth.Answer. United Kingdom
- A person who arrives in a country is calledAnswer. immigrant
- A person who leaves a country is calledAnswer. Emigrant
Class 8 Geography KSEEB Chapter 6 Human Resources notes
Human Resources D.Picture Interpretation
Look at the following picture and Answer the questions that follow:
(i) Carefully read the diagram given below and explain the concept it is representing.
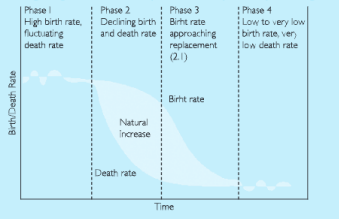
Answer. The chart shows the world population change though a demographic transition model.
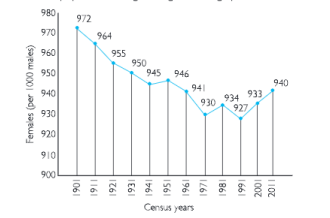
Answer. The picture shows the decadal change in sex ratio in India.