
KSEEB Solutions For Class 8 Maths Chapter 10 Data Handling Points To Remember
Data handling: Deals with the process of collecting data, presenting it and getting results.
Data mostly available to us in an unorganized form is called raw data.
Grouped data can be presented using a histogram Histogram is a type of bar diagram, where the class intervals are shown on the horizontal axis and the heights of the bars show the frequency of the class interval. Also, there is no gap between the bars as there is no gap between the class intervals.
Read and Learn More KSEEB Solutions for Class 8 Maths
In order to draw meaningful inferences from any data we need to organize the data systematically
Frequency gives the number of times that a particular entry occurs.
Raw data can be ‘grouped’ and presented systematically through ‘grouped frequency distribution’.
Statistics: The science which deals with the collection, presentation, analysis and interpretation of numerical data.
Observation: Each entry (number)in raw data.
Range: The difference between the lowest and the highest observation in a given data.
Array: Arranging raw data in ascending or descending order of magnitude.
| Class 10 Science | Class 11 Chemistry |
| Class 11 Chemistry | Transformation of Sentences |
| Class 8 Maths | Class 8 Science |
Data can also presented using circle graph or pie chart. A circle graph shows the relationship between a whole and its part.
There are certain experiments whose outcomes have an equal chance of occuring.
A random experiment is one whose outcome cannot be predicted exactly in advance
Outcomes of an experiment are equally likely if each has the same chance of occuring.
Frequency: The number of times a particular observation occurs in the given data.
Class interval: A group in which the raw data is condensed.
Kseeb Solutions For Class 8 Maths Chapter 10
1)Continuous: The upper limit of a class interval coincides with the lower limit of the next class.
2)Discontinuous: The upper limit of a class interval does not coincide with the lower limit of the next class.
Class limits: Each class in a bounded by two figures which are called class limits
1) Upper-class limit: The upper value of a class interval
2)Lower class limit: The lower value of a class interval
Class size or width: The difference between the upper-class limit and lower-class limit of a class.
Classmark: The mid-value of a class interval.
Class mark = Upper limit + lower limit/2
Graphic representation of data:
1)Pictograph: Pictorial representation of data using symbols.
2)Bar graph: A display of information using bars of uniform width, their heights proportional to the respective values.
3) Double bar graph: A bar graph showing two sets of data simultaneously. It is useful for the comparison of the data.
4)Histogram: A graphical representation of frequency distribution in the form of rectangles with class intervals as bases and heights proportional to corresponding frequencies such that there is no gap between any successive rectangles.
Circle graph or pie chart: A pictorial representation of the numerical data in the form of sectors of a circle such that area of each sector is proportional to the magnitude of the data represented by the sector. Probability: The chance of occurring of a certain event when measured quantitatively.
Probability of an event =Number of outcomes that make an event/Total number of outcomes of the experiment
when the outcomes are equally likely.
1)Experiment: An operation which can produce some well defined outcomes.
2)Trial: The performance of an experiment.
3)Random experiment: An experiment in which all possible outcomes are known and the exact outcome cannot be predicted in advance
4)Equally likely outcomes: Certain experiments whose outcomes have an equal chance of occurring
Event: Each outcome of an experiment or a collection of outcomes is called an event. Chances and probability are related to real life.
Karnataka Board 8th Maths Chapter 10 Data Handling Solutions
KSEEB Class 8 Maths Solutions For Chapter 10 Data Handling Exercise 10.1
1. For which of these would you use a histogram to show the data?
a)The number of letters for different areas in the postman’s bag.
b)The height of competitors in an athletics meet.
c)The number of cassettes produced by 5 companies.
d)The number of passengers boarding trains from 7 : 00 am to 7 : 00 p.m. station
Give reasons for each.
Solution: In case of the data given in alternative (b) and (d) we will use histogram as we can divide the given data in class intervals.
In case of alternatives (a) & (c) we do not know about the number of letters of different areas and the number of cassettes produced by the given companies. We do not have any approximate idea about it.
∴ We cannot define class intervals for this data and thus, we will not use a histogram.
Practice Questions For Data Handling KSEEB Maths
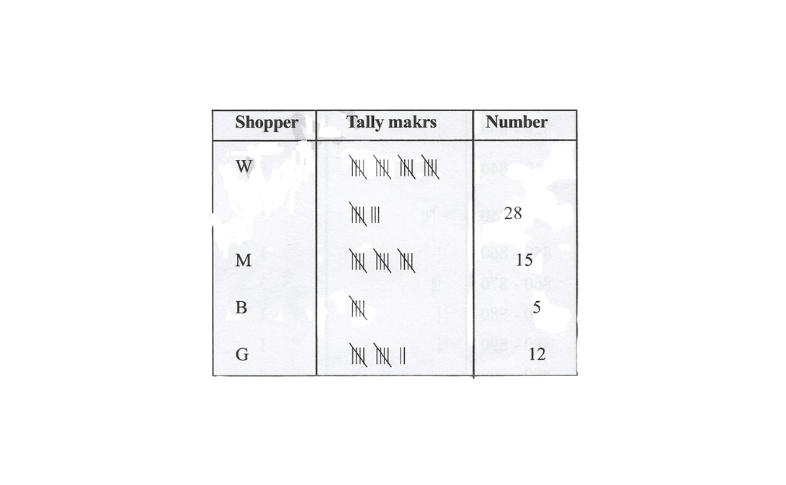
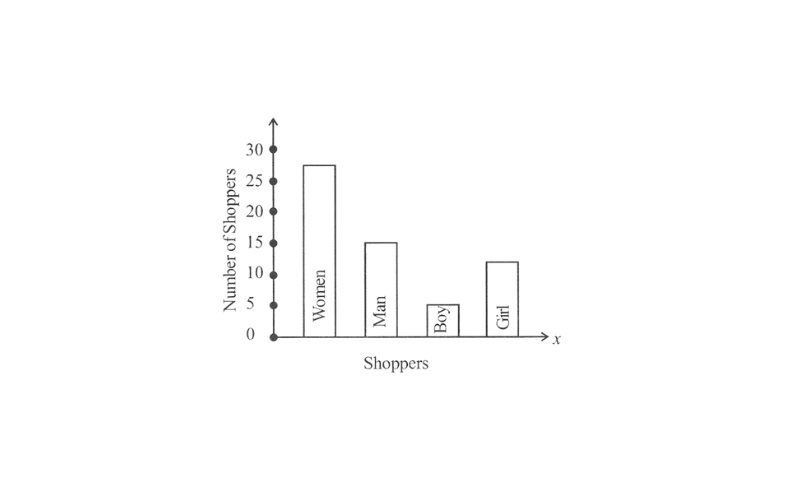
2. The Shoppers who come to a departmental store are marked as man(M), women (W), boy (B) or Girl (G). The following list gives the shoppers who came during the first hour in the morning. W W W G B W W M G G M M W W W W G B M W B G G M W W M M W W W M W B W G M W W W W G W M M W W M W G W M G W M M B G G W make a frequency distribution table using tally marks. Draw a bar graph to illustrate it.
Solution: By observing the data given above we can make a frequency distribution table as follows:
The bar graph of this data can be drawn as follows.
Kseeb 8th Standard Maths Chapter 10 Textbook Solutions
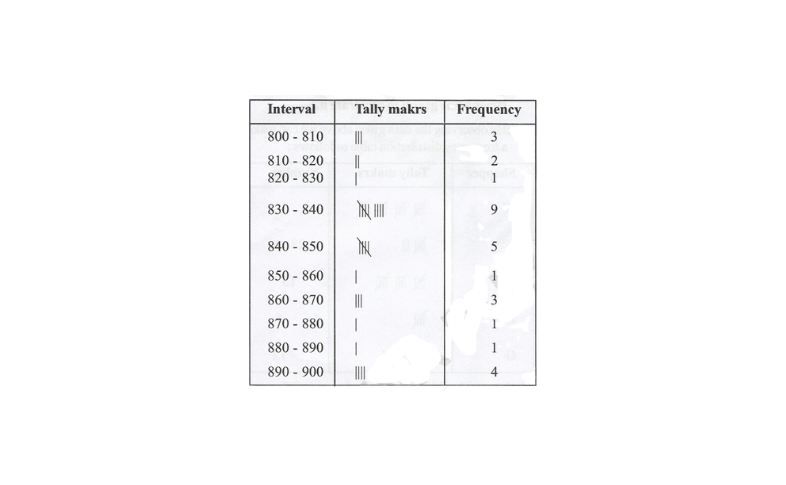
3. The weekly wages (in of 30 workers in a factory are: 830, 835, 890, 810, 835, 836, 869, 845, 898, 890, 820, 860, 832, 833, 855, 845, 804, 808, 812, 840, 885, 835, 835, 836, 878, 840, 868, 890, 806, 840. Using tally marks make a frequency table with intervals as 800 – 810,810 – 820 and so on.
Solution: A frequency distribution table by using tally marks for the above data is as follows.
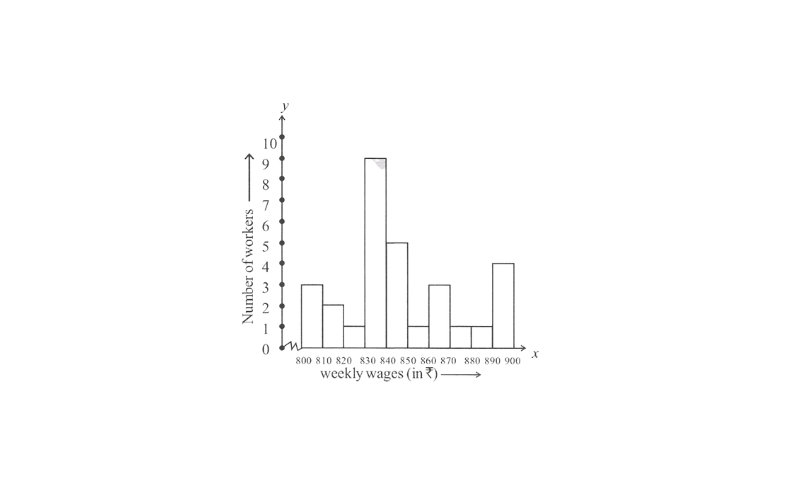
4.Draw a histogram for the frequency table made for the data in Q 3. and answer the following questions.
1)which group has the maximum number of workers?
2)How many workers earn ₹850 and more?
3)How many workers earn less than ₹850?
Solution: A histogram for the above frequency distribution table is as follows.
1)830 – 840 is the group which has the maximum number of workers
2)The workers who earn more than ₹850 are the number of workers who fall in the group of 850 – 860 or 860 – 870 or 870 – 880 or 880 – 890.
Hence, the total number of workers earning more than 850 will be the sum of the number of all these workers i.e. 1 + 3 + 1 + 1 + 4 = 10.
3)The workers who earn less than ₹850 are the number of workers who fall in the group of 800 – 810 or 810 – 820 or 820 – 830 or 830 – 840 or 840 – 850. Hence the total number of workers earning less than 850 will be the sum of the numbers of all these workers i.e., 3 + 2 + 1 + 9 + 5 = 20.
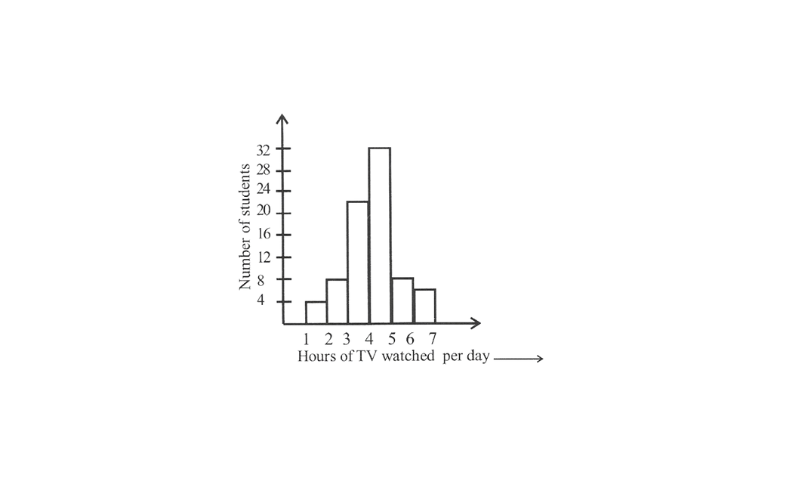
5.The number of hours for which students of a particular class watched television during holidays is shown through the given graph.
Answer the following.
1)For how many hours did the maximum number of students watch TV?
2)How many students watched TV for less than 4 hours?
3)How many students spent more than 5 hours in watching TV?
Class 8 Maths Chapter 10 Kseeb Important Questions And Answers
Solution: 1) From the graph, it can be observed that the maximum number of students (i.e., 32) watched TV for 4-5 hours.
2)The students who watched TV for less than 4 hours are the students who watched TV for 1 – 2 hours or 2 – 3 hours or 3 – 4 hours. Hence, total number of students = 4 + 8 + 22 = 34.
3)The students who watched TV for more than
5 hours are the students who watched TV for 5 –
6 hours (or) 6 – 7 hours.
Hence, the total number of students =8 + 6=14
Data Handling Questions And Answers KSEEB Maths
KSEEB Class 8 Maths Chapter 10 Data Handling Exercise 10.2
1. A survey was made to find the type of music that a certain group of young people liked in a city. Adjoining pie chart shows the findings of this survey. From this pie chart answer the following:
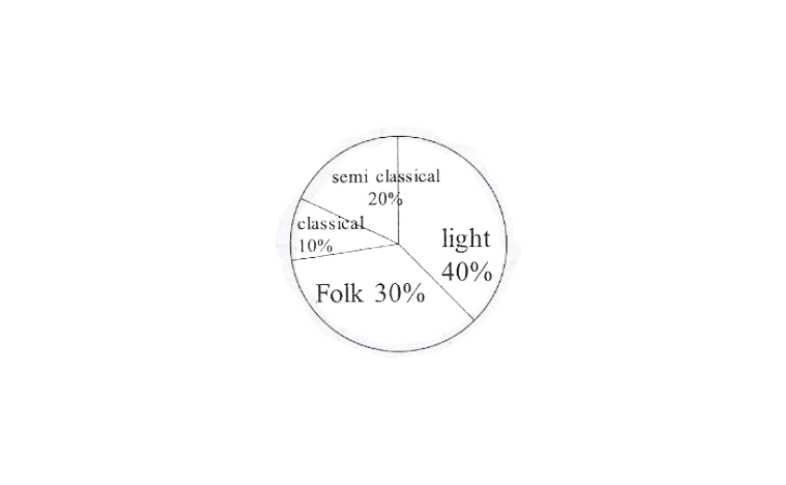
1) If 20 people liked classical music, how many young people were surveyed?
2) Which type of music is liked by the maximum number of people?
3) If a cassette company were to make 1000 CD’s how many of each type would they make?
Solution: 1) Number of people who like classical music = 10%
This 10% represents 20 people 20×100
100% represents = \(\frac{20 \times 100}{10}\) = 200 people
∴ 200 young people were surveyed.
2)From the pie chart, it can be easily observed that the light music is represented by the maximum part of the pie chart (Le., 40%). Hence, most of the people like light music.
3)Number of CD’s of classical music
= 10% of 1000
= \(\frac{10}{100} \times 1000\)
=100
Number of CD’s of semi-classical music
= 20% of 1000
= \(\frac{20}{100} \times 1000\)
= 200
Number of CD’s of folk music
= 30% of 1000
= \(\frac{30}{100} \times 1000\)
= 300
Number of cassettes of light music
= 40% of 1000
= \(\frac{40}{100} \times 1000\)
= 400
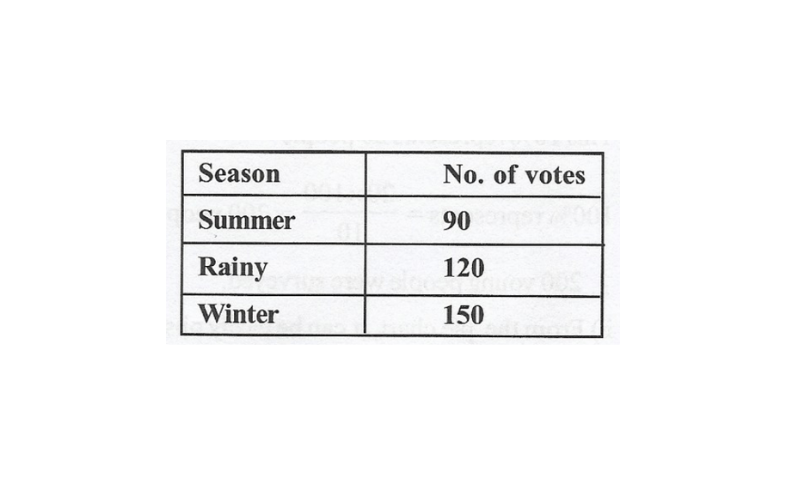
2. A group of 360 people were asked to vote for their favourite season from the three seasons rainy, winter and summer.
1) Which season got the most votes?
2)Find the central angle of each sector.
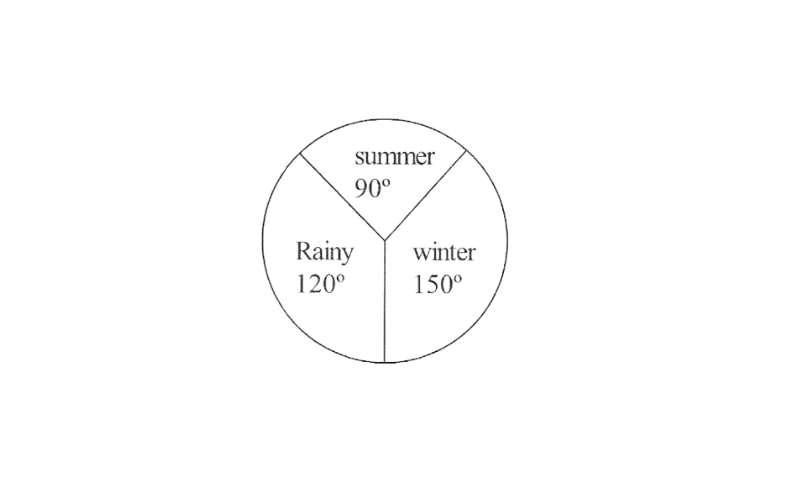
3)Draw a pie chart to show this information.
Data Handling Class 8 Kseeb Notes Pdf
Solution: 1) Winter
2) Total number of votes = 90 + 120 + 150= 360
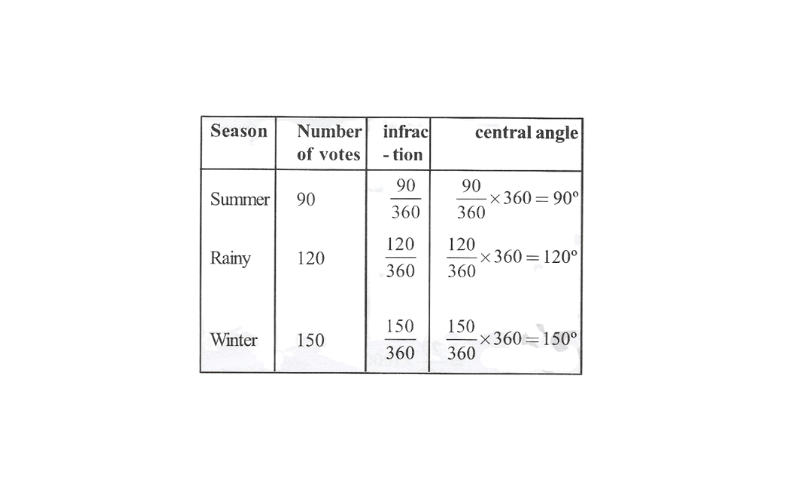
3) A pie chart can be drawn for the above data as follows:
3. Draw a pie chart showing the following information. The table shows the colours preferred by a group of people.
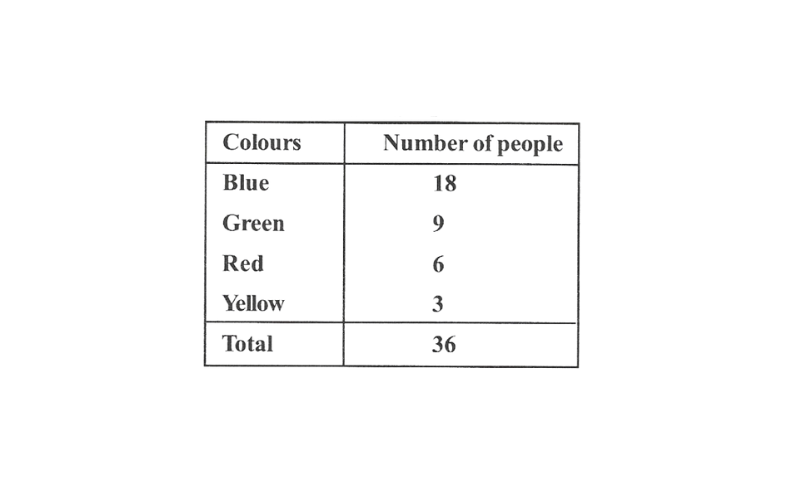
Solution: The central angle for each colour can be calculated as follows:
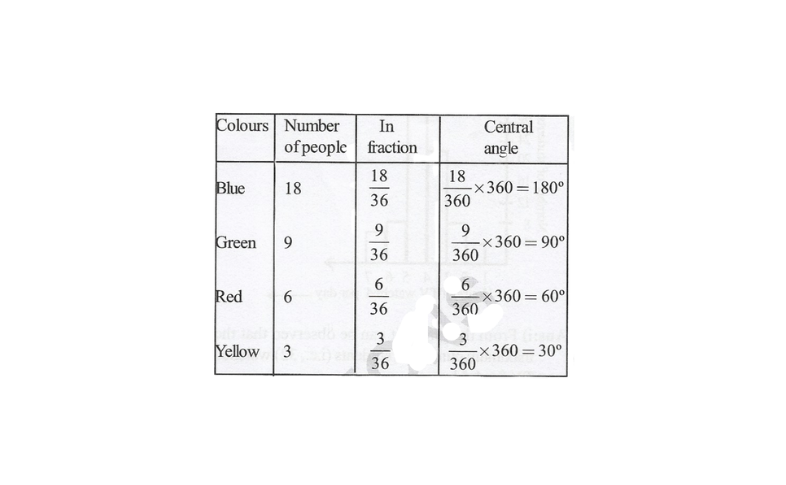
The pie chart of the above data is as follows.
Kseeb 8th Maths Chapter 10 Exercise Solutions Step By Step
4.The adjoining pie chart gives the marks scored in an examination by a student in Hindi, English, Mathematics, social science and science. If the total marks obtained by the students were 540, answer the following questions.
1)In which subject did the student score 105 marks?
2)How many more marks were obtained byy the student in mathematics than in Hindi?
3)Examine whether the sum of the marks obtained in social science and mathematics is more than that in science and Hindi.
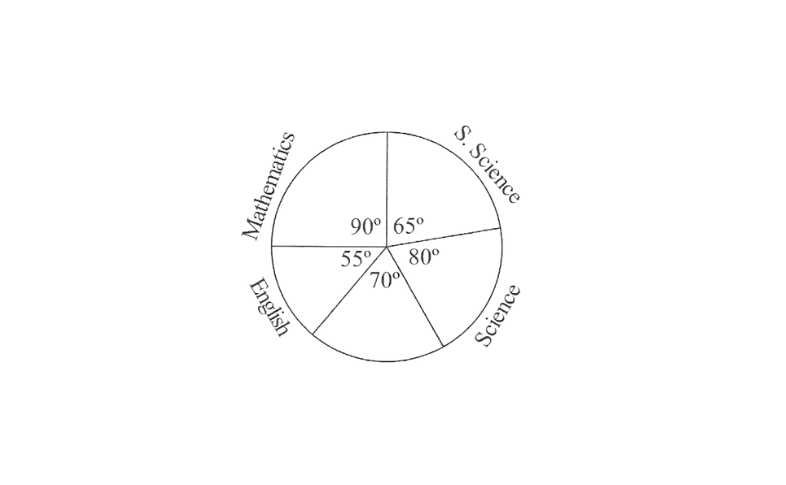
Solution: 1) Total marks obtained by the student are 540. Hence 540 marks represent 360°. The central angle for 105 marks has to be calculated.
Central angle for 105 marks = \(\frac{105}{540} \times 360^{\circ}=70^{\circ}\)
Hindi is the subject having its central angle as 70°
∴ The student scored 105 marks in Hindi
2) Difference between the central angles of mathematics and Hindi = 90°-70°=20°
Marks for 20° central angle =\(\frac{20^{\circ}}{360^{\circ}} \times 540=30\)
There is a difference of 30 marks between the score obtained in mathematics and Hindi.
∴ 30 more marks were obtained by the student in mathematics than in Hindi.
3) Sum of central angles of social science and mathematics = 90° + 65° = 155°
Sum of central angle of science and Hindi = 80 + 70 = 150°.
The sum of the central angles for social science and mathematics is mote than that of science and Hindi.
∴ The student scored more in social science and mathematics than in science and Hindi.
5. The number of students in a hostel, speaking different languages is given below, display the data in a pie chart.
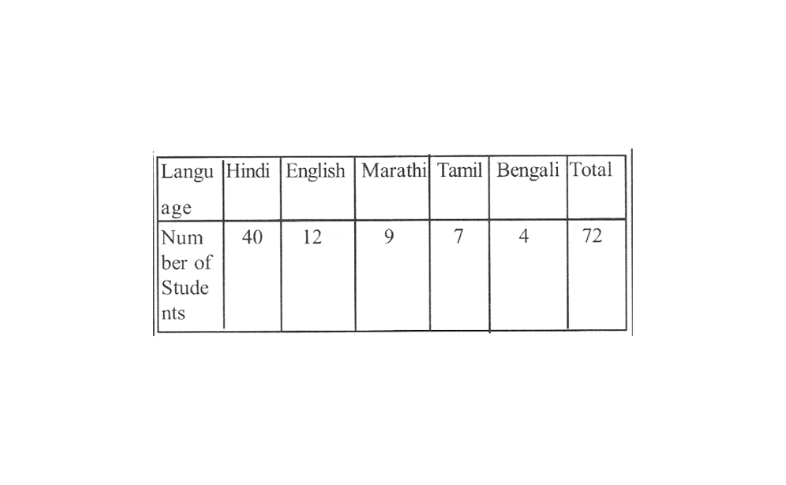
Solution: The central angle for each subject can be calculated as follows:
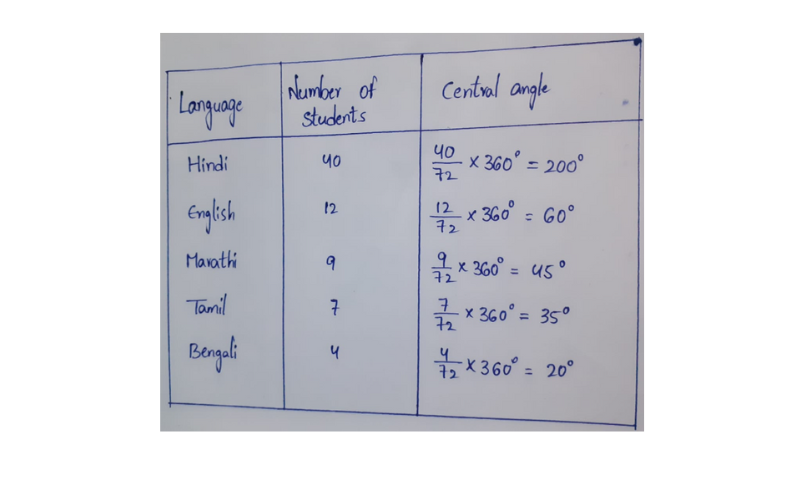
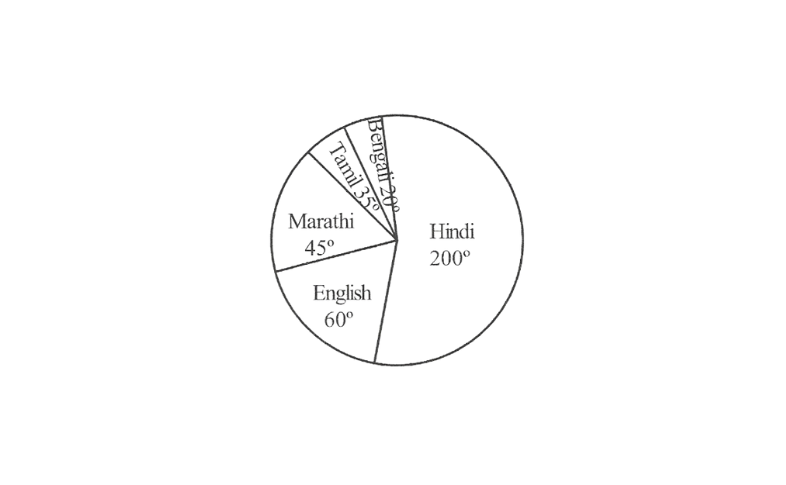
A pie chart of the above data is as follows.
Chapter 10 Solutions For KSEEB Maths Data Handling Exercise 10.3
1. List the outcomes you can see in these experiments.
a) Spinning a wheel
b) Tossing two coins together
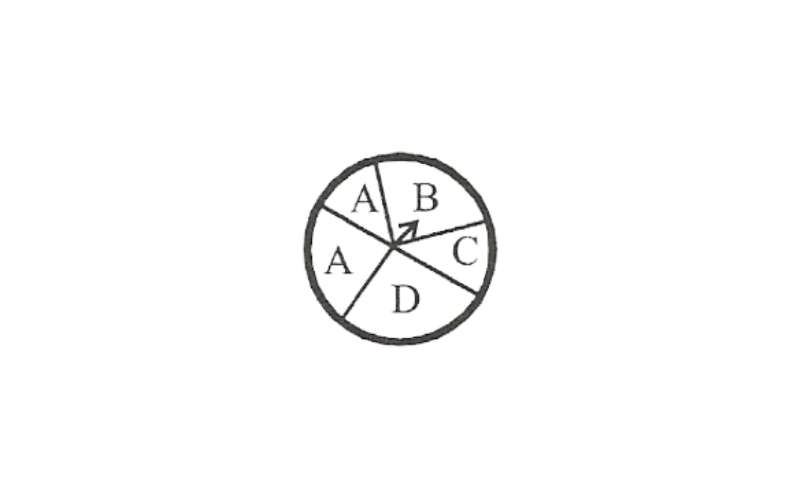
Solution: a) On spinning the given wheel, the possible outcomes are A, B, C, D.
b) By tossing two coins together, the possible outcomes are HT, TH, HH, TT, where H and T represents Head, and Tail of the coins respectively.
2. When a die is thrown, list the outcomes of an event of getting
1)a) a prime number
b) not a prime number
2) a) a number greater than 5
b) a number not greater than 5.
Solution: When a dice is thrown, the possible outcomes are 1, 2, 3, 4, 5 and 6.
1) a) out of these outcomes 2, 3, and 5 are prime numbers. Hence, these are the outcomes of an event of getting a prime number on the face of a dice.
b) out of these outcomes 1,4,6 are not prime number. Hence, these are the outcomes of an event of not getting a prime number on the face of a dice.
2)a) out of these outcomes, a number greater than 5 is possible when 6 comes on the face of the dice.
b) out of these outcomes, a number not greater than 5 is possible when the number on the face of the dice is any one of the outcomes 1,2,3,4,5.
KSEEB Class 8 Maths Solutions For Chapter 10 Data Handling
3. Find the
a)Probability of the pointer stopping on D in (Q-l-(a))?
b)Probability of the getting an ace from a well-shuffled deck of 52 playing cards?
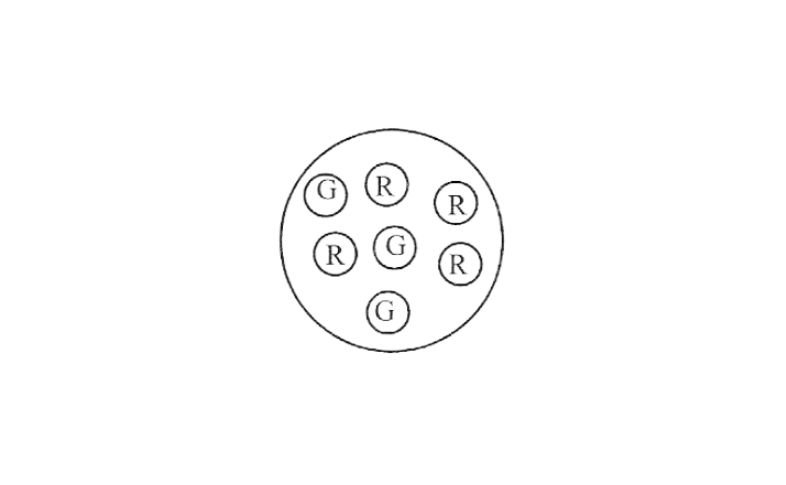
c)Probability of getting a red apple.
Solution: a) The pointer can stop at one of the following regions. A, A, B, C, D
out of these 5 cases, it is possible only in 1 case that the pointer will stop at region D.
∴ the probability that the pointer will stop at region \(D=1 / 5\)
b) There are 52 cards in a deck of cards and there are 4 ace cards in 1 deck of cards.
probability of getting an ace card = =\(\frac{4}{52}=\frac{1}{13}\)
c) There are a total of 7 apples, out of which 4 are red and 3 are green.
probability of getting a red apple = \(\frac{4}{7}\)
4. Numbers 1 to 10 are written on ten separate slips. (One number on one slip) kept in a box and mixed well. One slip is chosen from the box without looking into it. What is the probability of
1) getting a number 6?
2) getting a number less than 6?
3) getting a number greater than 6?
4) getting a 1-digit number?
Solution: 1) There are 10 slips in the box. However 6 is written only on 1 slip
1 Probability of gettiing a number \(6=\frac{1}{10}\).
2)The numbers less than 6 are 1,2, 3,4, 5
Probability of getting a number less than \(6=\frac{5}{10}\)
=\(\frac{1}{2}\)
3)The numbers greater than 6 are 7, 8, 9, 10 probability of getting a number greater than
\(6=\frac{4}{10}=\frac{2}{5}\)
4) There are 9 numbers which are single digit numbers, 1,2,3,4,5,6,7,8,9
probability of getting a single digit number = \(\frac{9}{10}\).
5.If you have a spinning wheel with 3 green sectors, 1 blue sector and 1 red sector. What is the probability of getting a green sector? What is the probability of getting a non blue sector?
Solution: Total sector = 3 + 1 + 1 = 5
There are 5 sectors and we can get a green sector in three cases.
Probability of getting a green sector = \(3 / 5\)
We will get a non blue sector when we will get either a green sector or a red sector.
Hence, 4 cases of such type are possible in which we will get a non blue sector.
Probability of getting a non blue sector = \(4 / 5\)
6.Find the probabilities of the events given in Question 2.
Solution: (1) (a) Out of 6 possible outcomes, a prime number can be obtained in three cases.
∴ Probability of getting a prime number = \(\frac{3}{6}=\frac{1}{2}\).
b) Out of 6 possible outcomes, a prime number may not be obtained in three cases.
∴ Probability of getting not a prime number
=\(\frac{3}{6}=\frac{1}{2}\)
2) (a) out of 6 possible outcomes, a number greater than 5 can be obtained in only 1 case.
∴ Probability of getting a number greater than
\(5=\frac{1}{6}\)
(b) Out of 6 possible outcomes, a number not greater than 5 can be obtained in 5 cases.
∴ Probability of getting a number not greater than
\(5=\frac{5}{6}\).
KSEEB Class 8 Maths Data Handling Additional Problems
1. The following pie charts give you a different piece of information about your class. Find the fraction of the circle representing the information.
Solution: Fraction of the circle representing the girl’s 50%
=\(\frac{50}{100}=\frac{1}{2}\)

2. When a die is thrown, what are the possible outcomes?
Solution: The possible outcomes are 1,2,3,4,5 or 6.
3. Classify the following statement under appropriate headings.
1) Getting the sum of angles of a △le as 180°.
Solution: certain to happen.
2) India winning a cricket match against Pakistan
Solution: may or may not happen.
3) Sun setting in the evening.
Solution: Certain to happen.
4) Getting 7 when a die is thrown
Solution: Impossible to happen.
5) Sun rising from the west
Solution: Impossible to happen.
6) Winning a racing competition by you
Solution: May or may not happen.
KSEEB Class 8 Maths Chapter 10 Solved Problems
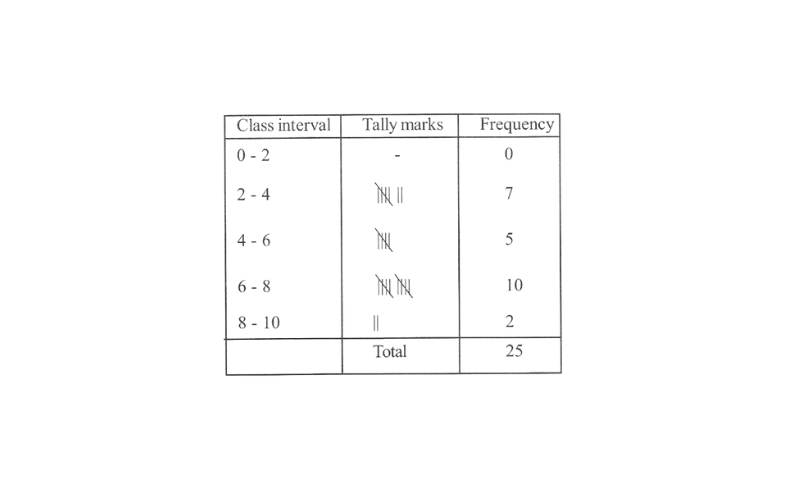
4.Following are the number of members in 25 families of a village : 6,8,7,7,6,5,3,2,5,6, 8,7,7,4,3,6,6,7,5,4,3,3,3,2,5 prepare a frequency distribution table for the data using class intervals. 0 – 2, 2 – 4 etc.
Solution:
Karnataka Board Class 8 Maths Data Handling Problems And Answers
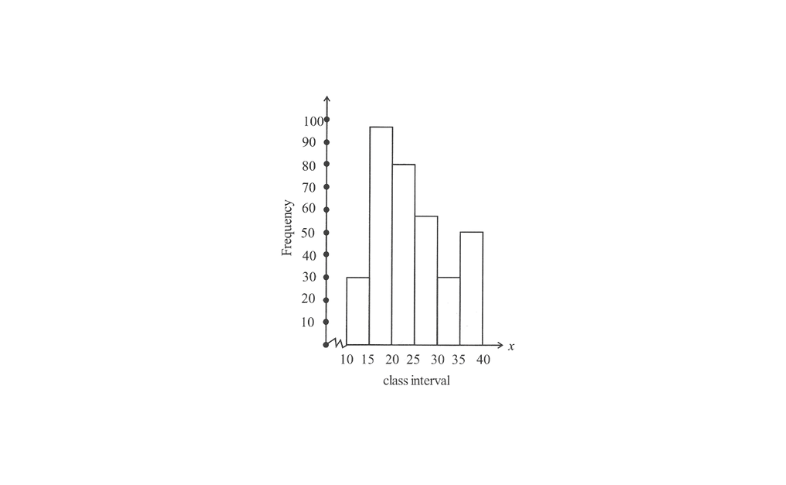
5. Draw a histogram for the following data.
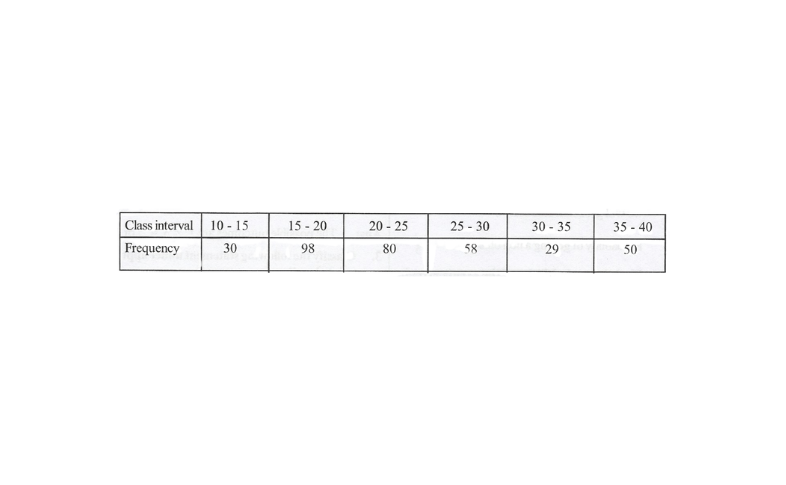
Solution:
6. Given below is a frequency distribution table. Read it and answer the questions that follows:
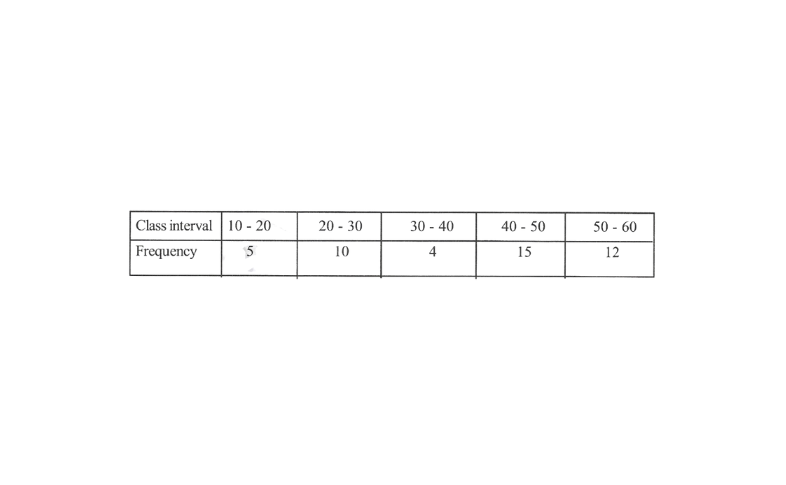
1) What is the lower limit of the second class interval?
2) What is the upper limit of the last class interval?
3) What is the frequency of the third class?
4) Which interval has a frequency of 10?
5) Which interval has the lowest frequency?
6) What is the class size?
Solution: 1)The second class interval is 20-30
∴ The lower limit = 20
2)The last class interval = 50 – 60
∴ The upper limit = 60
3)The frequency of the third class (30 – 40) = 4
4)The class interval having frequency 10
= 20-30
5)The interval having lowerst frequency
= 30-40
6)The class size = upper class limit – lower class limit = 20 – 10= 10
7.A dice is rolled once. What is the probability that the number on top will be
1) odd
2) Greater than 5
3) A multiple of 3
4) less than 1
5)A factor of 36
6) A factor of 6.
Solution: On rolling a die, all possible outcomes are 1, 2, 3,4,5,6. Total number of possible outcomes = 6
1) Odd number on the top of a die = 1, 3, 5
∴ Number of favourable outcomes = 3
The probability of getting odd number on the top.
P(E)=Number of favourable outcomes/Total number of outcomes
=\(\frac{3}{6}=\frac{1}{2}\)
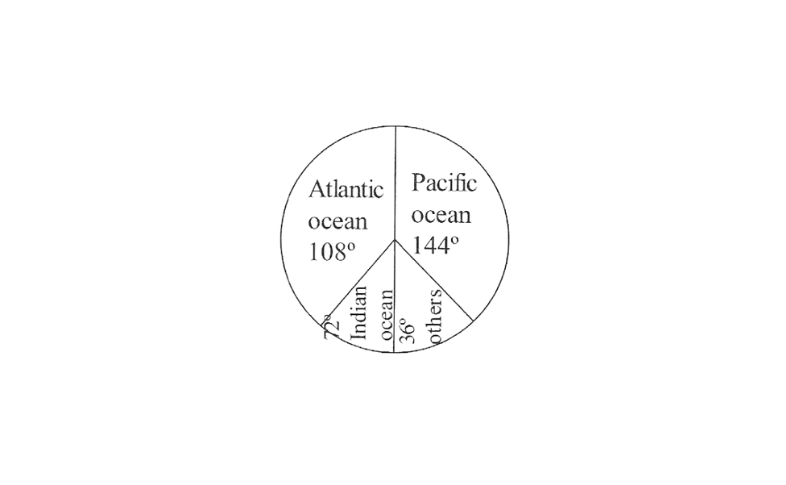
8.The following data represents the approximate percentage of water in various oceans. Prepare a pie chart for the given data.
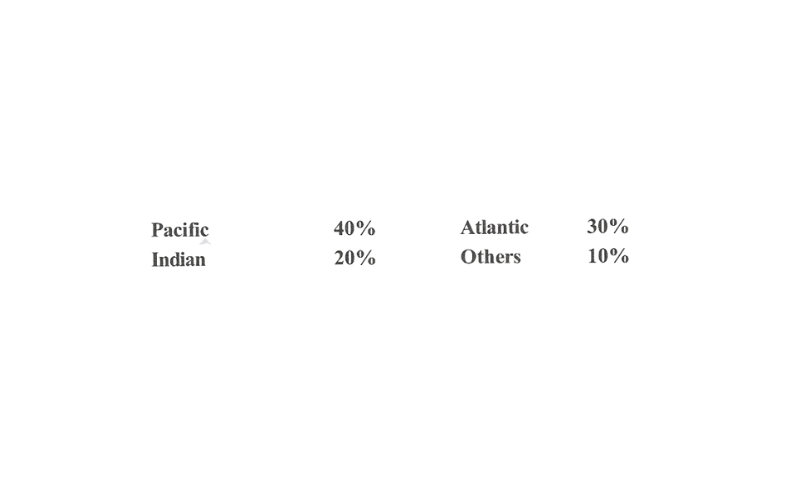
Solution: Total angle at the centre of the circle is 360°. We make a table to find the central angle of the sectors.
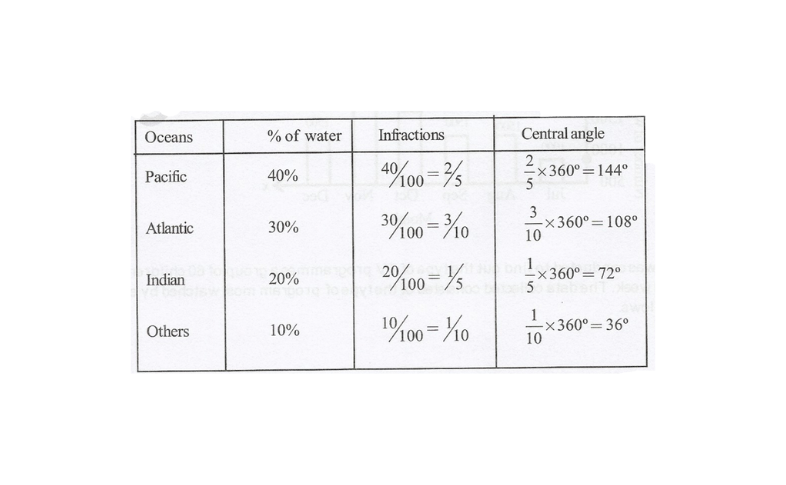
How To Solve Data Handling Problems In Class 8 Kseeb Maths
The pie chart is drawn as follows:
KSEEB Maths Class 8 Data Handling Notes
9. Identify which symbol should appear in each row.
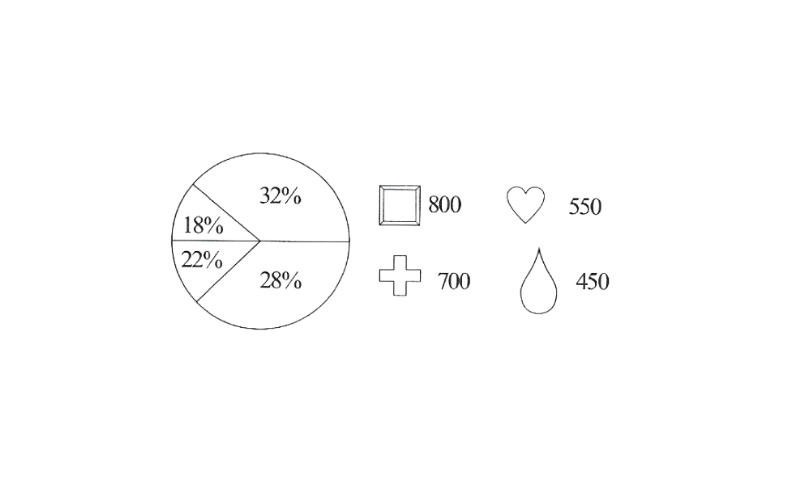
Solution: Total value = 800 + 700 + 550 + 450 = 2500
32% represents \(
\frac{32}{100} \times 2500=800\)
∴ 32% represents the symbol
28% represents \(\frac{28}{100} \times 2500=700\)
∴ 28% represents the symbol
22% represents \(\frac{22}{100} \times 2500=550\)
∴ 22% represents the symbol

18% represents \(\frac{18}{100} \times 2500=450\)
∴ 18% represents the symbol
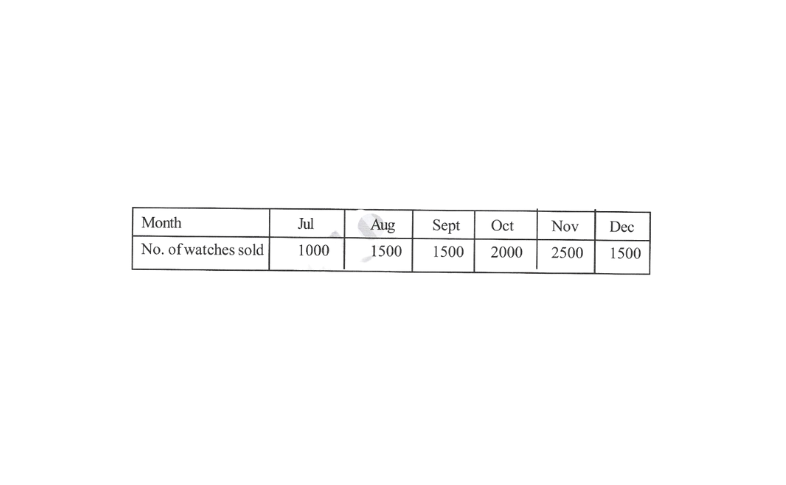
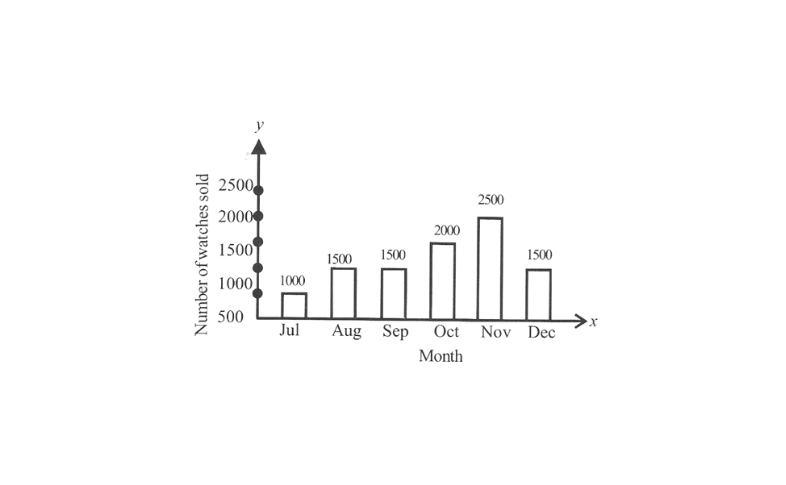
10. Draw an appropriate graph to represent the given information.
KSEEB Class 8 Maths Chapter 10 Data Handling
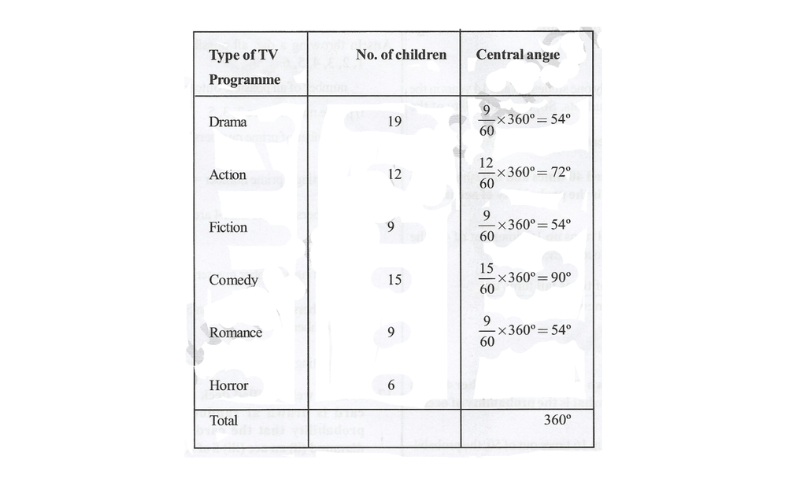
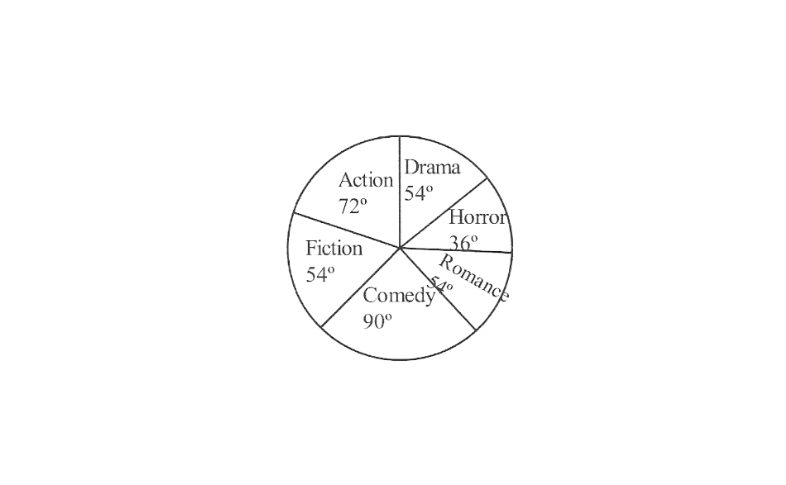
11. A survey was conducted to find out the type of TV programmes a group of 60 children watched through a week. The data collected consisted of the type of program most watched by each child. It is as follows.
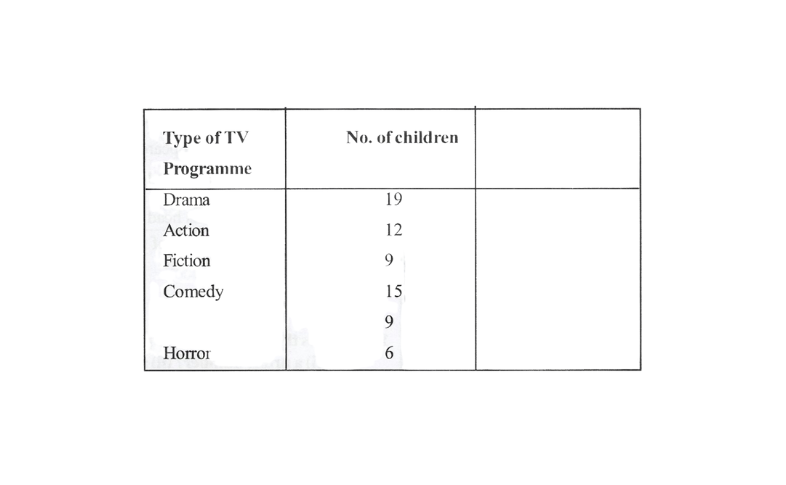
Solution:
12. There are 20 students in class 8. As per the school record there ages in years are as follows :
11 13 12 11 13 12 11 14 12 13 13 13 13
12 12 13 13 13 12 11
What is the probability that a student of this class selected at random is
(a) of age 11 years?
(b) of 14 years.
Solution: a) There are 4 students of age 11 years in the class of 20 students. So, the probability of the selected student will be 11 years of age is
\(4 / 20=1 / 5\)
b) There is only one student of age 14 years in the class of 20 students. So, the probability of the
selected student to be of age 14 years is \(\frac{1}{20}\).
13. A coin is tossed 40 times and tail turns up 16 times. What is the probability of occurrence of tail?
Solution: Since, the tail turns up 16 times out of 40, the probability of occurrence of tail is
= Number of times tail turns up/Total number of trails
=\(\frac{16}{40}=\frac{2}{5}\)
14. A die is thrown 50 times and number 4 turns up 16 times, what is the probability of occurrence of 4?
Solution: Since 4 turns up 16 times out of 50, the probability of occurrence of 4 is
= Number of times 4 turns up 16/Total number of trails
= \(\frac{16}{50}=\frac{8}{25}\)
15. A coin is tossed 100 times and tail is obtained 52 times. Now, if a coin is tossed at random, what is the probability of getting a head?
Solution: Total number of tosses =100
Number of times tail appeared = 52
Number of times head appeared = 100 – 52 = 48 Probability of a getting a head
= Number of times head appeared/Total number of tails
=\(\frac{48}{100}=\frac{12}{25}\)
16. A die is thrown, what is the probability of getting
1) a prime number?
2) a number greater
3) a number not greater than 5?
Solution: In throwing a die, all possible outcomes are 1,2, 3, 4, 5,6
number of all possible outcomes = 6
1)prime numbers are 2, 3, 5
Number of prime numbers = 3
∴ P(getting a prime number = \(\frac{3}{6}=\frac{1}{2}\)
2)Numbers greater than 4 are 5 & 6 their number is 2
∴ P(getting a number greater than 4 ) = \(\frac{2}{6}=\frac{1}{3}\)
3)Numbers not greater than 5 are 1, 2, 3,4, 5 their number is 5
∴ P(getting a number not greater than 5 = \(5 / 6\)
17.From a well shuffled deck of 52 cards, one card is drawn at random, what is the probability that the card drawn is
1) a diamond
2) an ace
3) 5 of club?
Solution: Total number of all cards = 52
Total number of all possible outcomes = 52
1)No. of diamonds =13
P(getting a diamond) = \(\frac{13}{52}=\frac{1}{4}\)
2)Number of all aces = 4
∴ p(getting an ace) = \(4 / 52=1 / 13\)
3) No. of 5 of club = 1
∴ p(getting an club)= \(1 / 52\)
18.On throwing a die once. Find the probability of occurrence of a composite number.
Solution: On throwing a die, the occurrence of composite numbers can be as 4,6.
Hence, probability of occurrence of a composite number = No. of composite numbers on a die/Total numbers on a die
=\(\frac{2}{6}=\frac{1}{3}\)