
KSEEB Solutions for Class 9 Maths Chapter 14 Statistics Points to Remember
- Facts or figures collected with a definite purpose are called data.
- Satistics deals with collection, presentation, analysis and interpretation of numerical data.
- Presentation of data includes arranging data in order to study their salient features.
- Data arranged in ascending or descending order is called arrayed data or an array.
The data are of two types:
1. Primary Data: Such data are collected by the investigator himself or herself with a definite purpose.
2. Secondary Data: Such data are collected from a source which already has the information gathered.
- When the data is presented without any specified order is called raw data. Numerical raw data is also known as ungrouped data.
- Variate: The quantity that is being measured from observation to observation is called a variate.
- Frequency: The number of times an observation is appearing is the frequency of observation.
- Range of the data is the difference between the maximum and the minimum values of the observations.
- Mean: The arithmetic mean of the data is defined as the sum of all the values of the variable divided by the number of values.
\(\text { Mean }=\frac{\text { Sum of all the observations }}{\text { Total number of observations }}\)
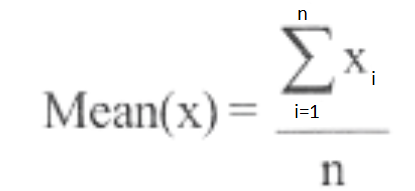 where n is the number of observations.
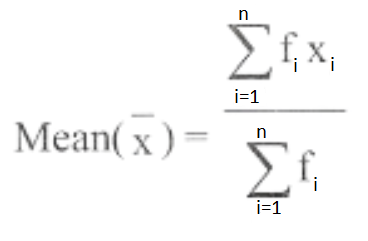 where the total number of observations is ∑fi
| Class 9 Social Science | Class 9 Science | Class 9 Maths |
- Median: Median is the value of the middle most observations.
- The Median is to be calculated only after arranging the data in ascending order or descending order.
- If the number of observations (n) is odd
Median =\(\left(\frac{n+1}{2}\right)^{\mathrm{th}}\) observation - If x is even.
Median = Mean of the values of the \(\left(\frac{\mathrm{n}}{2}\right)^{\mathrm{th}}\) and \(\left(\frac{n}{2}+1\right)^{\text {th }}\) observation - Mode: The observation with maximum frequency is called the mode.
- Data can be represented graphically in the following ways:
1. Bar graph
2. Histogram
3. Frequency polygon
Statistics EXERCISES 14.1
1. Give 5 examples of data that you can collect from your day-to-day life.
Solution:
1. Number of students in our class.
2. Number of fans in our school.
3. Electricity bills of a house for the last 3 years.
4. Election results obtained from television or newspaper.
5. Literacy rate figure obtained from the educational survey.
KSEEB Class 9 Maths Chapter 14 Solutions PDF
2. Classify the data in question 1 above as primary or secondary data.
Solution: Primary Data: 1, 2 and 3
Secondary Data: 4 and 5
Statistics Exercise 14.2
1. The blood groups of 30 students of class VIH a recorded as follows:
A, B, O, O, AB, O, A, O, B, A, O, B, A, O, O, A,
AB, O, A, A, O, O, AB, B, A, O, B, A, B, O.
Represent this data in the form of a frequency distribution table. Which is the most common and which is the rarest blood group among these students?
Solution:
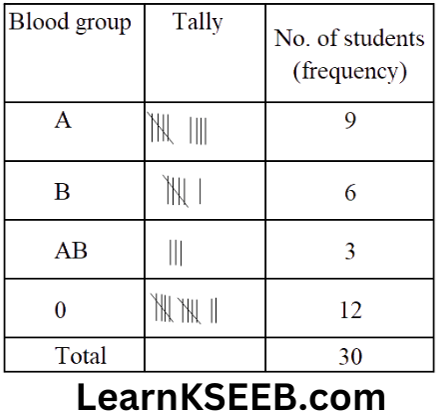
O is the most common and AB is the rarest blood group among these students.
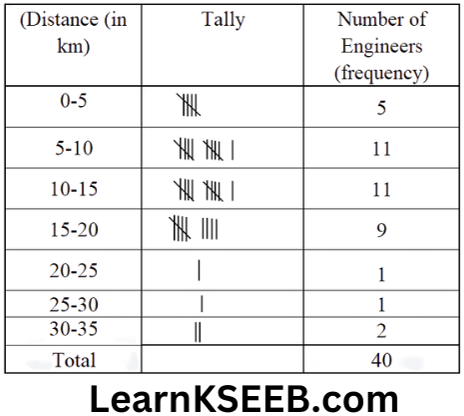
2. The distance (in km) of 40 engineers from their residence to their place of work were found as follows:
5 3 10 20 25 11 13 7 12 31 19 10
12 17 18 11 32 17 16 2 7 9 7 8 3 5
12 15 18 3 12 14 2 9 6 15 15 7 6
12
Construct a grouped frequency distribution table with class size 5 for the data given above, taking the first interval as 0 – 5 (5 not included). What main features do you observe from this tabular representation?
Solution:
We observe the following main features from this tabular representation:
1. The distance (in km) from their residence to their work place of the maximum number of engineers are in the third interval i. e. 10-15.
2. The distance (in km) from their residence to their work place of the minimum number of engineers are in the intervals 20-25 and 25-30 each.
3. The frequencies of the intervals 20-25 and 25-30 are the same. (Each=1)
3. The relative humidity (in %) of a certain city for a month of 30 days is as follows:
98.1 98.6 99.2 90.3 86.5 95.3 92.9 96.3
94.2 95.1 89.2 92.3 97.1 93.5 92.7 95.1
97.2 93.3 95.2 97.3 96.2 92.1 84.9 90.2
95.7 98.3 97.3 96.1 92.1 89.0
1. Construct a grouped frequency distribution table with classes 84-86, 86-88, etc.
2. Which month or season do you think this data is about?
3. What is the range of this data?
Solution:
(1)
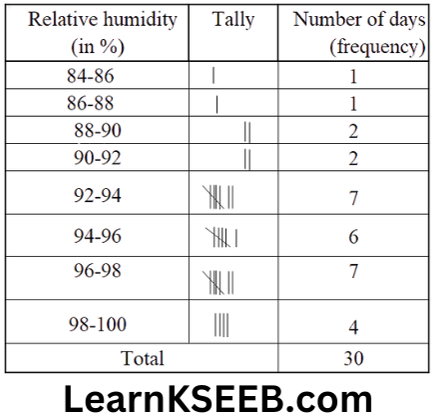
(2) This data appears to be taken in the rainy season as the relative humidity is high.
(3) Range = highest value – the lowest value
= 99.2 – 84.9
= 14.3(in%)
4. The height of 50 students, measured to the nearest centimetres, have been found to be as follows:
161 150 154 165 168 161 154 162 150 151 162
164 171 165 158 154 156 172 160 170 153 159
161 170 162 165 166 168 165 164 154 152 153
156 158 162 160 161 173 166 161 159 162 167
168 159 158 153 154 159
1. Represent the data given above by a grouped frequency distribution table, taking the class intervals as 160-165,165-170, etc.
2. What can you conclude about their heights from the table?
Solution:
(1)
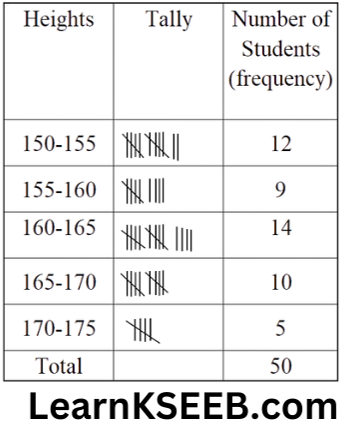
The heights of maximum number of students are in the group 160-165 and the heights of minimum number of students are in the group 170-175.
(2)More than 50% of students are shorter than 165 cm.
5. A study was conducted to find out the concentration of Sulphur dioxide in the air in parts per million(ppm) of a certain city. The data obtained for 30 days is as follows:
0. 03 0.08 0.08 0.09 0.04 0.17 0.16 0.05 0.02 0.06
0. 18 0.20 0.110.08 0.12 0.13 0.22 0.07 0.08 0.01
0. 10 0.06 0.09 0.18 0.110.07 0.05 0.07 0.01 0.04
1. Make a grouped frequency distribution table for this data with class intervals has 0.00-0.04,0.04-0.08 and so on.
2. For how many days was the concentration of Sulphur dioxide more than 0.11 parts per million?
Solution:
1.
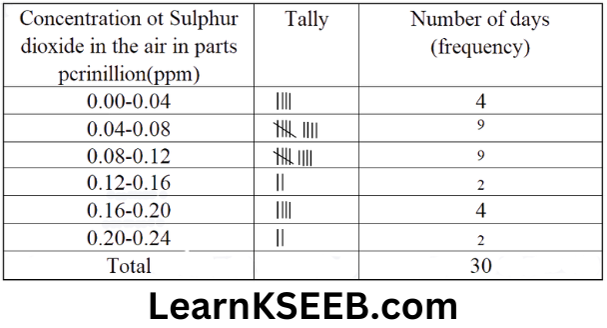
2. The concentration of Sulphur dioxide was more than 0.11 parts per million for 2+4+2=8 days.
Karnataka 9th Standard Maths Chapter 14 Notes
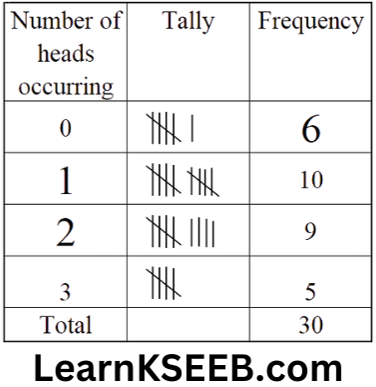
6. Three coins were tossed 30 times simultaneously. Each time the number of heads occurring was noted down as follows:
0 1 2 2 1 2 3 1 3 0 1 3 1 1 2 2 0 1 2 1 3 0 0 1 1 2 3 2 2 0
Prepare a frequency distribution table for the data given above.
Solution:
7. The value of n upto 50 decimal places is given below:
3.14159265358979323846264338327950288419716939937510
1. Construct a frequency distribution table of the digits from 0 to 9 after the decimal point.
2. What are the most and the least frequently occurring digits?
Solution:
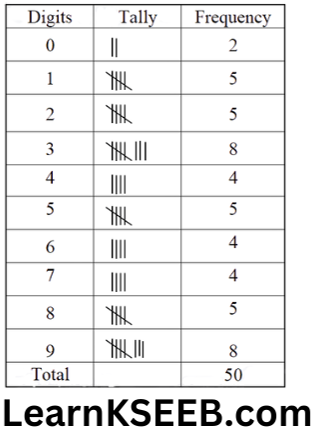
2. The Most frequently occurring digits are 3 and 9. The least frequently occurring digit is 0.
8. 30 children were asked about the number of hours they watched the TV programmes in the previous week. The results were found as follows:
1 6 2 3 5 1 2 5 8 4 8 10 3 4 12 2 8 15 1 17 6 3 2 8 5 9 6 8 7 14 12
1. Make a grouped frequency distribution table for this data. Taking class width 5 and one of the class intervals as 5-10.
2. How many children watched television for 15 or more hours a week?
Solution:
1.
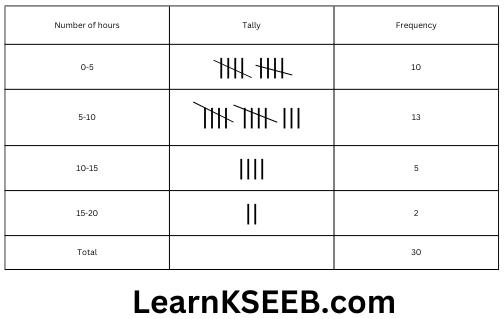
2. Two children watched television for 15 or more hours a week.
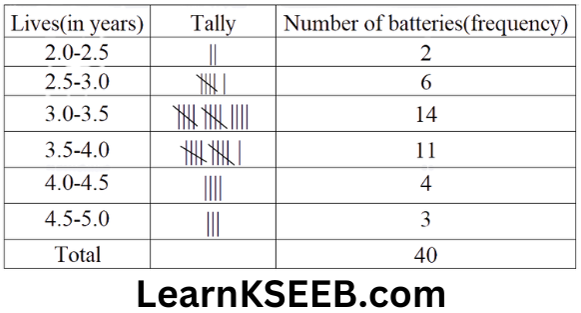
9. A company manufactures car batteries of a particular type. The lives(in years) of 40 such batteries were recorded as follows:
2.6 3.0 3.7 3.2 2.2 4.1 3.5 4.5 3.5 2.3
3.2 3.4 3.8 3.2 4.6 3.7 2.5 4.4 3.4 3.3
2.9 3.0 4.3 2.8 3.5 2.2 3.9 3.2 3.2 3.1
3.7 3.4 4.6 3.8 3.2 2.6 3.5 4.2 2.9 3.6
Construct a grouped frequency distribution table for this data, using class intervals of size 0.5 starting from interval 2-2.5.
Solution:
Statistics EXERCISES 14.3
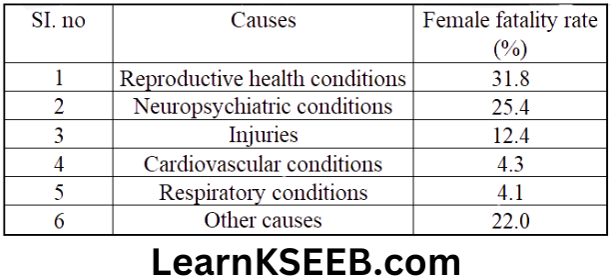
1. A survey conducted by an organisation for the cause of illness and death among women between the ages 15-44(in years) worldwide, found the following figures(in %).
1. Represent the information given above graphically.
2. Which condition is the major cause of women’s ill health and death worldwide?
3. Try to find out with the help of your teacher any two factors which play a major role in the cause in (2) above being the major cause.
Solution:
1.
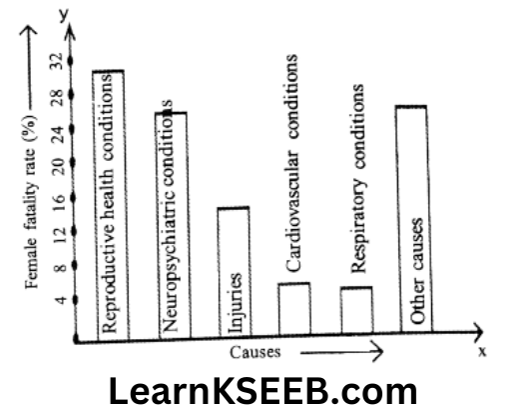
2. Reproductive health conditions are the major cause of women’s ill health and death worldwide.
3. Lack of proper diet, lack of advised exercises.
2. The following data on the number of girls(to the nearest ten) per thousand boys in different sections of Indian society is given below.
1. Represent the information above by a bar graph.
2. In the classroom discuss what conclusion can be arrived at from the graph.
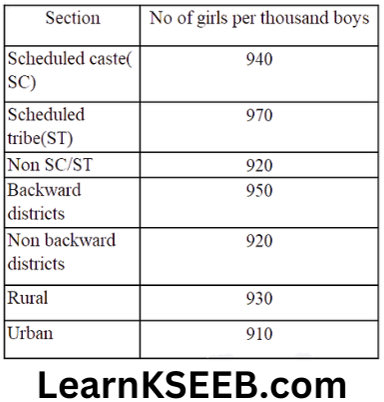
Solution: 1.
3. Given below are the seats won by different political parties in the polling outcome of a state assembly election.
Political party A B C D E F
Seats won 75 55 37 29 10 37
1. Draw a bar graph to represent the polling results.
2. Which political party won the maximum number of seats?
Solution: 1.
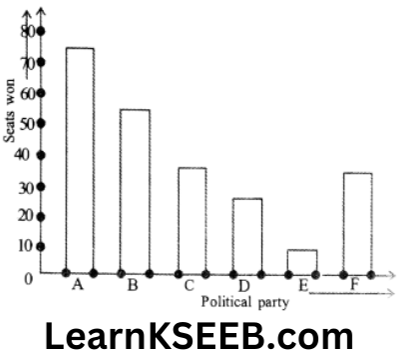
2. Political party A won the maximum number of seats.
4. The length of 40 leaves of a plant are measured correct to 1 millimetre and obtained data is represented in the following table.
1. Draw a histogram to represent the given data.
2. Is there any other suitable graphical representation for the same data?
3. Is it correct to conclude that the maximum number of leaves are 15 millimetres long? Why?
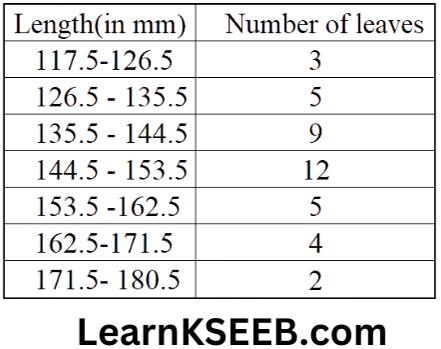
Solution:
1. Modified Continuous Distribution
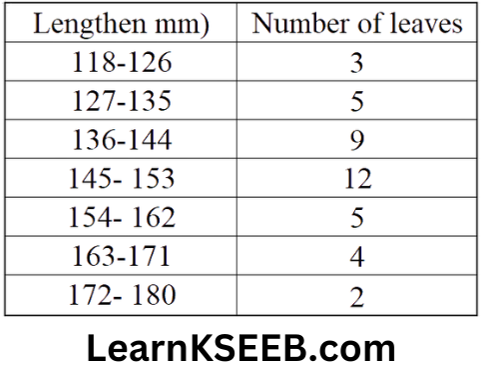
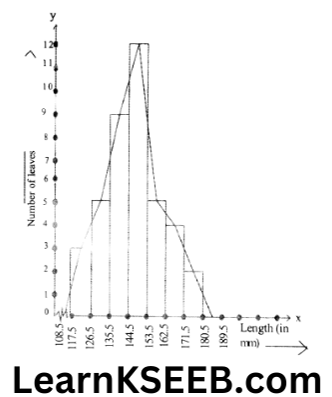
2. Frequency polygon
3. No, because the maximum number of leaves have their lengths lying in the interval 145-153.
5. The following table gives the lifetime of 400 neon lamps.
1. Represent the given information with the help of a histogram.
2. How many lamps have a lifetime of more than 700 hours?
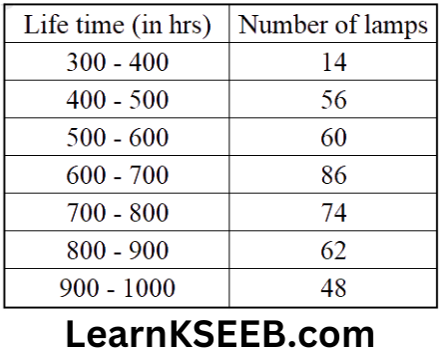
Solution:
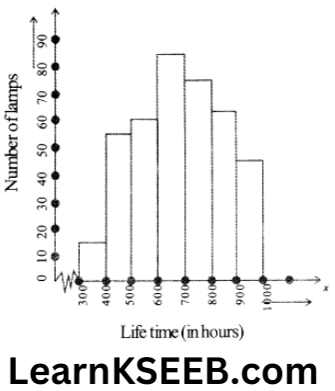
2. 74 + 62 + 48 = 184 lamps have a lifetime of more than 700 hours.
KSEEB Class 9 Maths Statistics Solutions
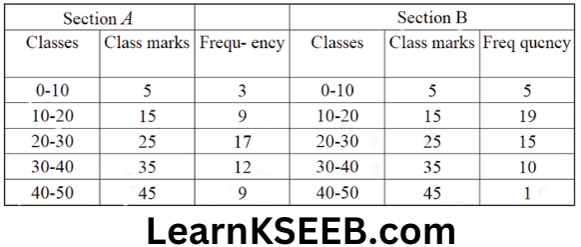
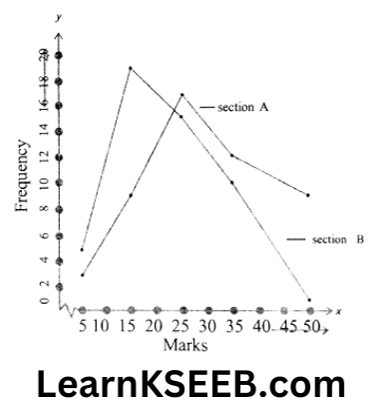
6. The following table gives the distribution of students of two sections according to the marks obtained by them.
Represent the marks of the students of both sections on the same graph by two frequency polygons. The two polygons compare the performance of the two sections.
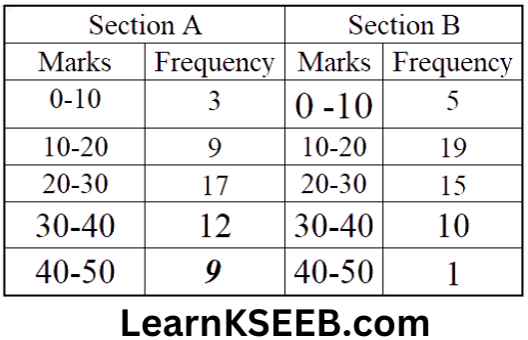
Solution: Modified table
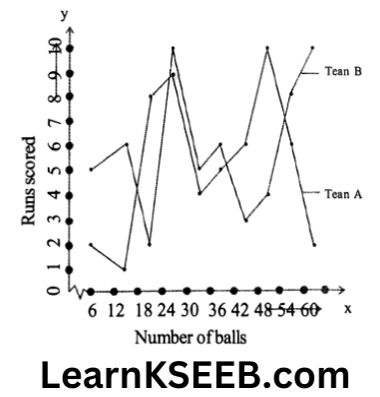
7. The runs scored by two teams A and B on the first 60 balls in a cricket match are given below.
Represent the data of both teams on the same graph by frequency polygons.
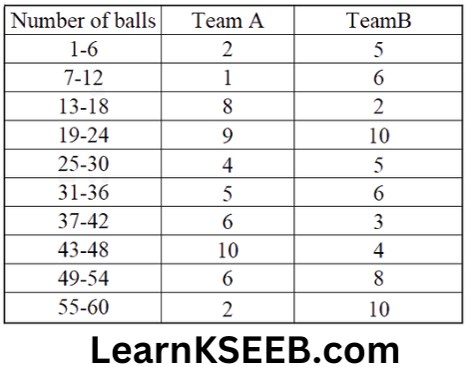
Solution: Modified Table

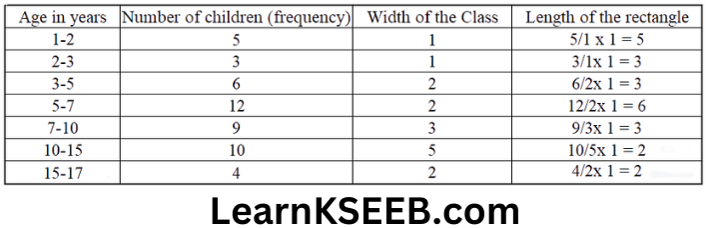
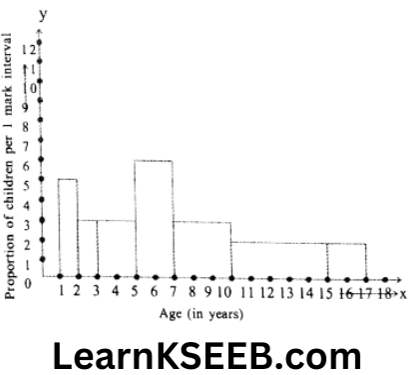
8. A random survey of the number of children of various age groups playing in a park was found as follows:
![]()
Draw a histogram 11 to represent the data below.
Solution:
9. 100 surnames were randomly picked up from a local telephone directory and a frequency distribution of the number of letters in English alphabet in the surnames was found as follows:
Number of letters 1-4 4-6 6-8 8-12 12-20
Number of 6 30 44 16 4
surnames
1. Draw a histogram to depict the given information.
2. Write the class interval in which the maximum number of surnames lie.
Solution:
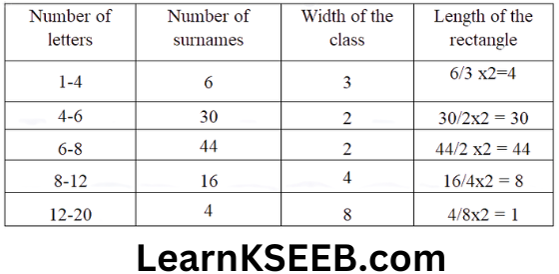
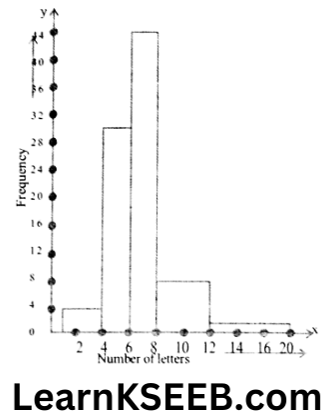
2. The class interval in which the maximum number of surnames lie is 6-8.
Statistics EXERCISES 14.4
1. The following number of goals were scored by a team in a series of 10 matches.
2, 3, 4, 5, 0,1,3, 3, 4,3
Find the mean, median and mode of these scores.
Solution: 1. Mean
\(\text { Mean }=\frac{\text { Sum of all the observations }}{\text { Total number of observations }}\) \(=\frac{2+3+4+5+0+1+3+3+4+3}{10}\)\(=\frac{28}{10}\) = 2.8
2. Median
Arranging the given data in ascending order we
have, 0, 1,2, 3, 3, 3, 3, 4,4, 5
Number of observations(n) = 10
which is even
∴ Median =
\(=\frac{\left(\frac{10}{2}\right)^{\text {th }} \text { observation }+\left(\frac{10}{2}+1\right)^{\text {th }} \text { observation }}{2}\) \(=\frac{3+3}{2}=\frac{6}{2}=3\)3. Mode
Here 3 occurs most frequently (4 times)
∴ Mode = 3
2. In a mathematics test given to 15 students, the following marks(out of 100) are recorded.
41,39,48,52,46,62,54,40,96,52,98,40,42, 52, 60
Find the mean, median and mode of this data.
Solution:
1. \(\text { Mean }=\frac{\text { Sum of all the observations }}{\text { Total number of observations }}\)
& 41+39+48+52+46+62+54+40 \\
= & \frac{+96+52+98+40+42+52+60}{15} \\
= & \frac{822}{15}=54.8
\end{aligned}\)
2. Median
Arranging the given data in descending order we have,
98, 96, 62, 60, 54, 52, 52, 52, 48, 46, 42, 41,40, 40,39
Number of observations(n) = 15, which is odd
Median = \(\left(\frac{\mathrm{n}+1}{2}\right)^{\mathrm{th}}\)
\(=\left(\frac{15+1}{2}\right)^{\mathrm{th}}\) observation
= 8th observation = 52
3. Mode
Here 52 occurs most frequently(3 times)
∴ Mode = 52
3. The following observations have been arranged in ascending order. If the median of the data is 63, find the value of x.
29, 32, 48, 50, x, x+2, 72, 78, 84, 95
Solution: Number of observations(n) = 10, which is even
∴ Median =
\(=\frac{\left(\frac{\mathrm{n}}{2}\right)^{\mathrm{th}} \text { observation }+\left(\frac{\mathrm{n}}{2}+1\right)^{\mathrm{th}} \text { observation }}{2}\) \(=\frac{\left(\frac{10}{2}\right)^{\text {th }} \text { observation }+\left(\frac{10}{2}+1\right)^{\text {th }} \text { observation }}{2}\) \(=\frac{x+(x+2)}{2}=\frac{2 x+2}{2}=x+1\)According to the question
x + 1 = 63
=> x = 63 – 1 = 62
Hence, the value of x is 62.
Hence the value of x is 62.
4. Find the mode of 14,25,14,28,18,17,18, 14, 23, 22, 14,18.
Solution: Arranging the data in ascending order we have 14, 14, 14, 14, 17, 18, 18, 18, 22,23, 25, 28.
Here 14 occurs most frequently (4 times)
∴ Mode = 14
Class 9 Maths KSEEB Chapter 14 Statistics Examples
5. Find the mean salary of 60 workers of a factory from the following table:
Salary (in₹) 3000 4000 5000 6000 7000 8000 9000 10000
Number of workers 16 12 10 8 6 4 3 1
Solution:
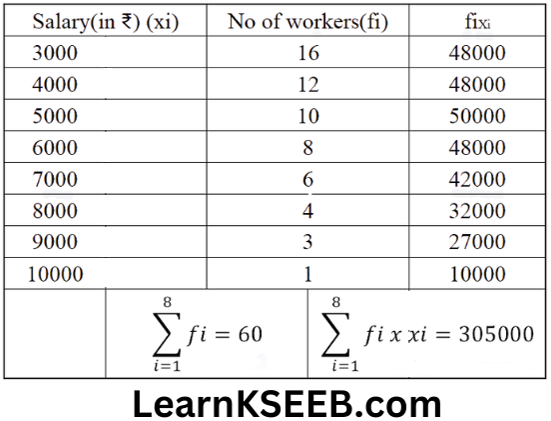
Hence the mean salary is ₹5083.33
6. Give one example of a situation in which
1. The mean is an appropriate measure of central tendency.
2. The mean is not an appropriate measure of central tendency but the median is an appropriate measure of central tendency.
Solution:
1. The mean marks in a test, in mathematics,
2. Average beauty
Multiple Choice Questions
1. The lower limit of the class 31 -35 is
- 31
- 33
- 35
- 30
Solution: 1. 31
2. The range of the following frequency distribution is 2.7, 2.7, 2.8, 2.1, 2.4, 3.2, 2.1, 3.1, 2.8, 3.2
- 2.1
- 1.6
- 5.3
- 1.1
Solution: 4. 1.1
3. The width of the class interval 70.5- 75.5 is
- 5
- 2.5
- 0.5
- 10
Solution: 1. 5
4. The median of the following series is 520, 20, 340, 190, 35, 800, 1210, 50, 80
- 1210
- 520
- 190
- 35
Solution: 3. 190
KSEEB 9th Standard Maths Chapter 14 Important Questions
5. If the mean of 5, 7,9, x is 9 then the value of x is
- 11
- 15
- 18
- 16
Solution: 2. 15
6. The mode of distribution 3, 5,7,4,2,1,4, 3,4 is
- 7
- 4
- 3
- 1
Solution: 2. 4
7. The median of the first 10 odd numbers is
- 10
- 8
- 9
- 11
Solution: 1. 10
8. For what values of x, is the mode of the following data 9?
5, 8, 9, 3, 9, 8, 7, 6, 8, 9, x, 4
- 7
- 8
- 9
- 6
Solution: 3. 9
9. Mean of first 10 natural numbers is
- 6.5
- 5.5
- 7.5
- 8.5
Solution: 2. 5.5
10. If the mean of the data 2, x + 1,9, x – 2 is 4, then the value of x is
- 2
- 3
- 4
- 5
Solution: 2. 3
Statistics EXTRA SUMS
1. Find the mean of the first 5 prime numbers.
Solution: Prime numbers 2,3, 5, 7,11
\(\text { Mean }=\frac{2+3+5+7+11}{5}=\frac{28}{5}=5.6\)2. The mean of perimeters of two squares having sides x units and y units
Solution: 2(x + y) units
3. If the mean of the 5 observations x, x + 2, x + 4, x + 6, x + 8 is 13 then, find the value of x.
Solution:
\(\text { Mean }=\frac{x+x+2+x+4+x+6+x+8}{5}\) \(\begin{aligned}& 13=\frac{5 x+20}{5} \\
& 65-20=5 x \\
& 45=5 x \\
& x=45 / 5=9
\end{aligned}\)
Karnataka Board Class 9 Maths Chapter 14 MCQs
4. Find the mean of the following distribution,
x 4 6 9 10 15
f 5 10 10 7 8
Solution:
\(\text { Mean }=\frac{\sum f_i x_i}{\sum f_i}\) \(\begin{aligned}& =\frac{4 \times 5+6 \times 10+9 \times 10+10 \times 7+15 \times 8}{40} \\
& =\frac{20+60+90+70+120}{40}=\frac{360}{40}=9
\end{aligned}\)
5. The mean of 5 observations was calculated as 145, but it was later on detected that one observation was misread as 45 in place of 25. Find the correct mean of the observations.
Solution:
\(\text { Mean }=\frac{\text { Sum of all the observations }}{\text { Number of observations }}\)Total of all observations = 145 x 5 = 725
Correct total of all observations = 725 – 45 + 25
= 705
∴ Correct mean = 705/5 = 141
6. Arithmetic mean of terms 21,16,24, x, 29,15 is 23. Find the value of x.
Solution:
\(\text { A.M }=\frac{21+16+24+x+29+15}{6}\) \(\begin{aligned}& 23=\frac{105+x}{6} \\
& 105+x=138 \\
& x=138-105=33
\end{aligned}\)
7. The average height of 30 students is 150 cm. It was later detected that one observation of 165 cm was wrongly copied as 135 cm. Find the correct mean height.
Solution:
\(\text { Mean }=\frac{\text { Sum of all the observations }}{\text { Number of observations }}\)observation = 150×30 = 4500
Correct sum of observation = 4500 – 135 + 165 = 4530
∴ Correct mean= 4530/30 = 151
Class 9 Maths Statistics KSEEB Guide
8. A cricketer has a mean score of 58 runs in 9 innings. Find out how many runs to be scored in the 10th innings to raise his mean score to 61.
Solution: Total score of 9 innings = 58 x 9=522
For mean score of 61, the total needed = 61 x 10 = 610
Score to be added in the 10th innings =610-522 =88
KSEEB Maths Solutions Chapter 14 Practical Problems
9.The mean of the following distribution is 50.
xi 10 30 50 70 90
yi 17 5p+3 32 7p-11 19
Find the value of P.
Solution:
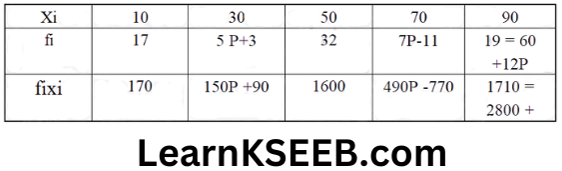
50 = 2800 + 640P/60+12P
\(\begin{aligned}& 3000+600 \mathrm{P}=2800+640 \mathrm{P} \\
& 3000-2800=640 \mathrm{P}-600 \mathrm{P} \\
& \Rightarrow 200=40 \mathrm{P} \\
& \Rightarrow \mathrm{P}=\frac{200}{40}=5
\end{aligned}\)
10. If the mean of the following distribution is 6, find the value of m.
x 2 4 6 10 m+5
y 3 2 3 1 2
Solution:
\(\text { Mean }=\frac{2 \times 3+4 \times 2+6 \times 3+10 \times 1+2 \mathrm{~m}+10}{3+2+3+1+2}\)\(6=\frac{6+8+18+10+2 m+10}{11}\)
\(\begin{aligned}
& \Rightarrow 66=52+2 m \\
& \Rightarrow 2 m=66-52=14 \\
& \Rightarrow m=14 / 2=7
\end{aligned}\)
11. Find the median of the following data.
2,12, 32,17, 26, 39, 42,12,18, 32,15
Solution: Arrange the data in increasing order
2, 12, 12, 15, 17, 18, 26, 32, 32, 39, 42
Here n is odd
∴ Median = \(\left(\frac{\mathrm{n}+1}{2}\right)^{\mathrm{th}}\) observation
12. Find the value of 3x + 1, if median of 2, 3, x, x + 2, 11,17 is 9.
Solution: Median of the observation=mean of the 3 rd and 4th observation
\(\begin{aligned}& =\frac{x+(x+2)}{2}=9 \\
& 2 x+2=18 \\
& x=\frac{18-2}{2}=\frac{16}{2}=8
\end{aligned}\)
∴ \(3 x+1=3 \times 8+1=24+1=25\)
13. Determine the median of the observations 24, 23, a, a -1, 12, 12 where a is the mean of 10, 20, 30, 40, 50.
Solution:
\(\text { Mean }=\frac{10+20+30+40+50}{5}=\frac{150}{5}=30\)Arranging in ascending order, we get
12, 16, 23, 24, 29, 30 as a = 30, a – 1 = 29
∴ Median of data = \(\frac{23+24}{2}=\frac{47}{2}=23.5\)
14. Find the mode of the observation 17, 23, 25, 18,17, 23,19,23,17, 26,23. If 4 is subtracted from each observation, what will be the mode of the new observations?
Solution: Arranging the data in ascending order
17, 17, 17, 18, 19, 23, 23, 23, 23, 25, 26
Mode = 23
New mode = 23 – 4 = 19
KSEEB Class 9 Maths Chapter 14 Exercise Solutions
15. Find mean, median, mode of the following data. 41, 39, 48, 52, 41, 48, 36, 41, 37, 35
Solution:
\(\text { Mean }=\frac{\sum x_i}{N}=\frac{418}{10}=41.8\)Arranging the data in increasing order, we get
35,36,37,391,41,41,41,48,48, 52
There are 10 observations
∴ Median = \(\frac{41+41}{2}=41\)
Mode = 41 (maximum frequency)
16. Find the range of the following data is 25,18, 20, 22, 16, 6, 17, 12, 30, 32,10, 19, 8,11, 20
Solution: Range = Highest score – Lowest score
= 32 – 6 = 26
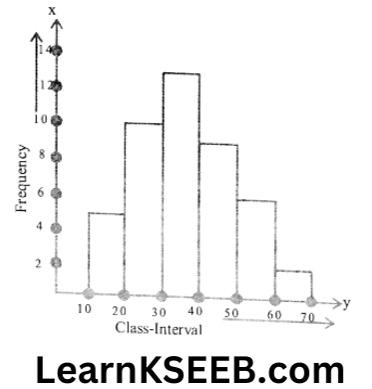
17. Draw a histogram of the following data.
Class 10-20 20-30 30-40 40-50 50-60 60-70
Frequency 5 10 13 9 6 2
Solution:
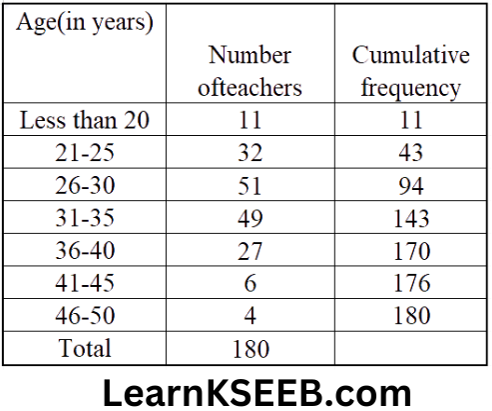
18. For a tabular year, following is the distribution of the ages(in years) of primary school teachers in a particular state.
1. Determine the class limits of the fourth class.
2. What is the class size?
3. Construct a cumulative frequency table
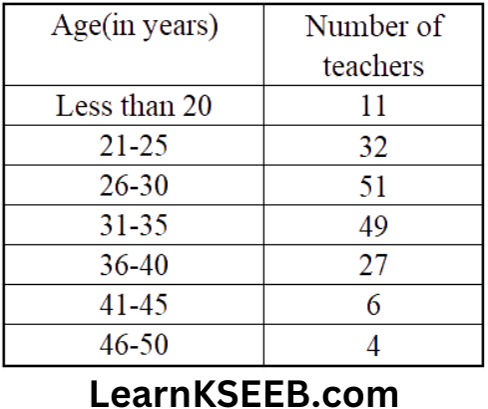
Solution:
1. Class limits of the fourth class Lower limit 31, Upper limit 35
2. Class size = 25 – 21 + 1 = 5
3. Cumulative frequency table
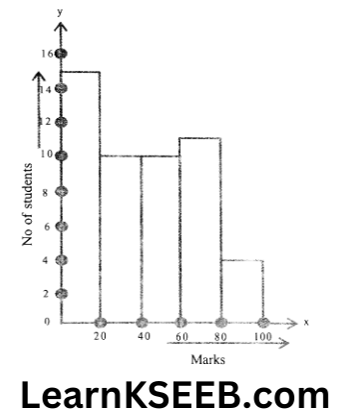
19. Consider the marks out of 100, obtained by 50 students of a class in a test given below
Mark 0-20 20-40 40-60 60-80 80-100
Number
of students 15 10 10 11 4
Draw a frequency polygon representing the data.
Solution:
20. The Mean of 10, 12, 16, 20, P and 26 is 17. Find the Value of P.
Solution:
\(\text { Mean }=\frac{10+12+16+20+P+26}{6}\) \(17=\frac{84+P}{6}\)=> 120 – 84 = P
=> P = 18